
Figures & data
Table 1 Demographic Profile of Patients with Inflammatory Bowel Disease at Reference Centers in Three States of Northeast Brazil
Figure 1 Number of newly diagnosed cases every five years in patients with inflammatory bowel disease at reference centers in three states of Northeast Brazil.
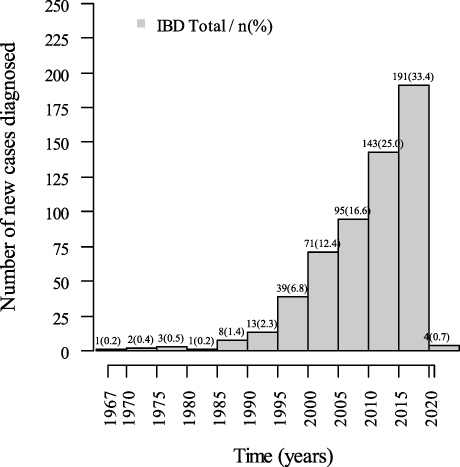
Figure 2 Trend and frequency of newly diagnosed cases observed that over time in patients with inflammatory bowel disease at reference centers in three states of Northeast Brazil. It was observed that over time, inflammatory bowel disease presented an average growth rate of 0.81 per year with statistical significance (p < 0.0001).
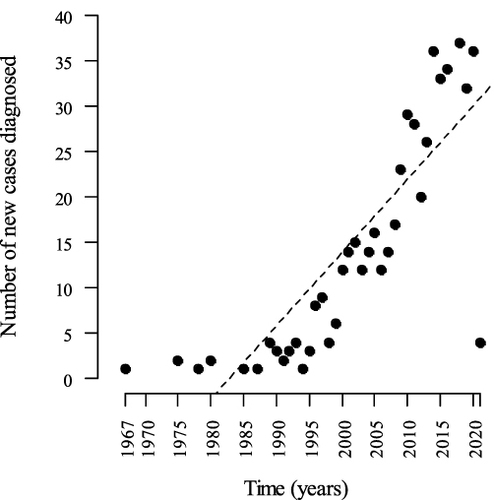
Table 2 Montreal Classification of Patients with Inflammatory Bowel Disease at Reference Centers in Three States of Northeast Brazil
Table 3 Extraintestinal Manifestations in Patients with Inflammatory Bowel Disease at Reference Centers in Three States of Northeast Brazil
Table 4 Therapy Used in Patients with Inflammatory Bowel Disease at Reference Centers in Three States of Northeast Brazil