Figures & data
Table 1 Representative Human Plasma Bilirubin Values in Normal and Pathological Conditions. Concentrations are in μmole/Liter and (in Parenthesis) mg/dl. Analytic Chromatographic (HPLC) Values Were Used When They Were Available; Otherwise, the Standard Diazo Assay Values are Used
Figure 1 Kinetic model of hepatic bilirubin transport and metabolism. M=rate of bilirubin production. UBp, UBc = Unconjugated plasma and cell concentration, respectively. CBp, CBc = Conjugated plasma and cell concentration, respectively. JUB, JCB = OATP mediated influx rate of UB and CB, respectively. Concentrations (UB, CB) are in units of mg/dl and fluxes (M, J) are in units of mg/day.
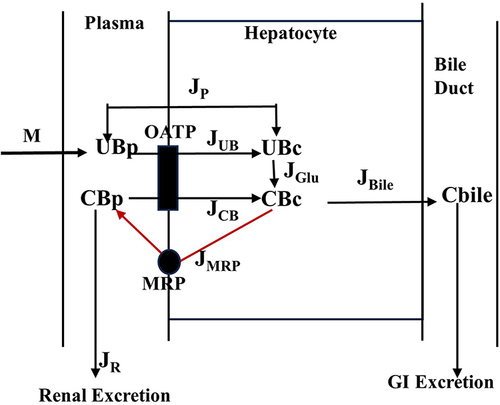
Table 2 Summary of the Normal Human Quantitative Model Parameters and Rate Constants
Table 3 Model Plasma UB and CB Concentrations for Different Pathological Fractional Decreases in the Biliary Secretion Rate Constant (RBile)
Figure 2 Plasma UB (black) and CB (red) concentration as function of the relative decrease in biliary secretion rate (RBile, green). The normal condition is for x=1 fold reduction, and x = 50 corresponds to a RBile of 1/50th of normal. The fractional reduction of the biliary secretion rate (green) is indicated on the right side of the graph.
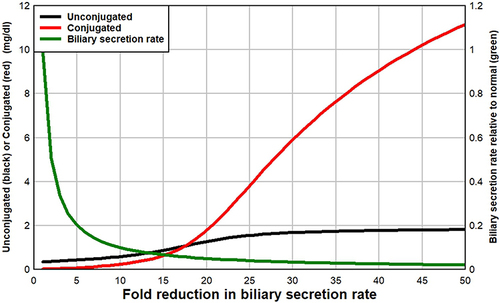
Table 4 Model Plasma UB and CB Concentrations for Different Pathological Fractional Decreases in the Rate of UB Glucuronidation (RGlu)
Table 5 Model Plasma UB and CB Concentration for Pathological Increases in the Rate of Bilirubin Production (M)
Table 6 Increase in Plasma UB and CB (mg/dl) Concentration as the Functional Impairment Parameter FR Decreases from 1 (Normal) to 0.025, Simulating Alcoholic Cirrhosis. The Corresponding Reductions in the 5 Model Rate Constants (VM, RBile, P, RGlu, RMRP) are Listed in the Second and Third Columns
Figure 3 Model simulation of alcoholic cirrhosis. The plasma unconjugated (black) or conjugated (red) bilirubin (mg/dl) is plotted as a function of the inverse of the functional impairment parameter (FR). The value of FR =1 corresponds to the normal state.
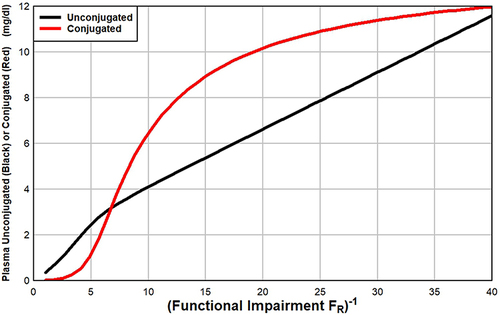
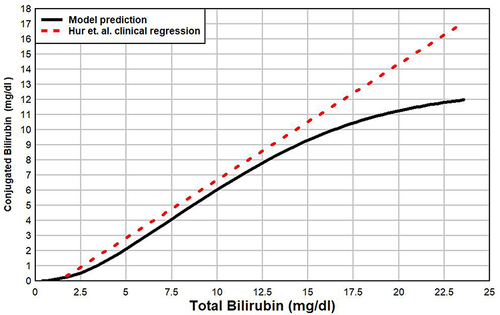
Figure 4 Plot of the conjugated bilirubin versus total bilirubin for increasing severity of alcoholic cirrhosis. The black line is the model prediction, and the red dashed line is the clinical regression relation of Hur and Park.