Figures & data
Figure 1 Goal-oriented classification of image-enhancement, magnifying, and microscopic techniques currently available and approved for clinical use.
Abbreviations: AFI, autofluorescence imaging; CLE, confocal laser endomicroscopy; EC, endocytoscopy; FICE, Fuji intelligent chromoendoscopy; HDE, high-definition endoscopy; NBI, narrow-band imaging.
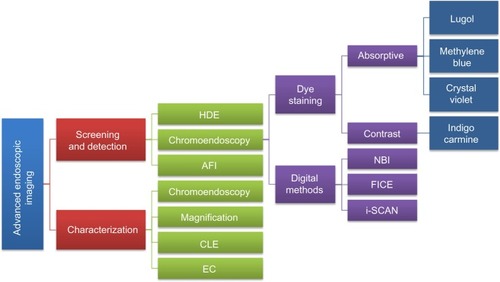
Figure 2 (A) Conventional endoscopic view of Barrett’s esophagus with concomitant esophagitis. (B) Positive staining of Barrett’s epithelium after absorption chromoendoscopy with methylene blue dye solution (1%, 10 mL). (C) Villous cerebroid pits with finger-like projections seen with magnification endoscopy (pattern 5 according to Endo’s classification). (D) Histological section of (C) showing intestinal metaplasia with glands of different size and shape and numerous goblet cells.
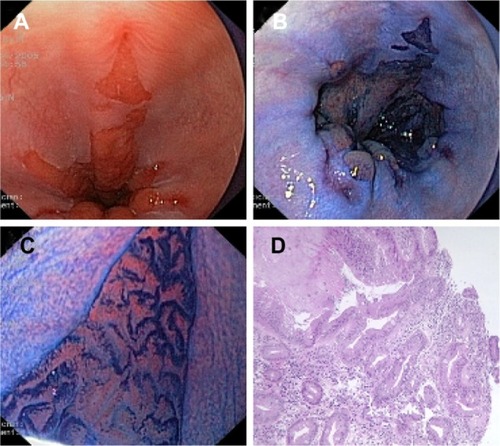
Figure 3 Example images of areas of suspected early cancers of the gastric antrum (A and B) and cardia (C and D), imaged using standard WLE (A and C) and NBI (B and D) to demonstrate the contrast enhancement provided by NBI.
Abbreviations: NBI, narrow-band imaging; WLE, white-light endoscopy.
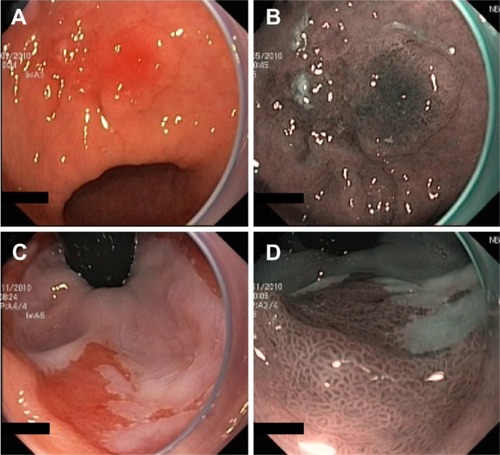
Figure 4 Schematic diagram showing the difference between a standard RGB filter (A) and the NBI filter (B).
Abbreviations: CCD, charge-coupled device; NBI, narrow-band imaging; RGB, red, green, and blue.
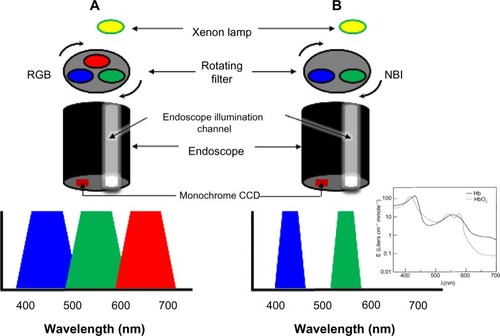
Figure 5 Example images of a suspected early cancer of the gastric antrum, imaged using standard WLE (A) and AFI (B), to demonstrate the contrast enhancement provided by AFI (Olympus Corporation, Tokyo, Japan).
Abbreviations: AFI, autofluorescence imaging; WLE, white-light endoscopy.
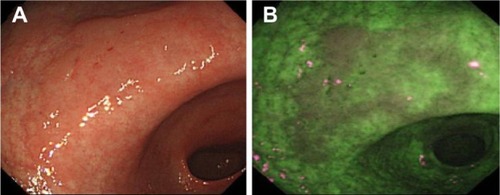
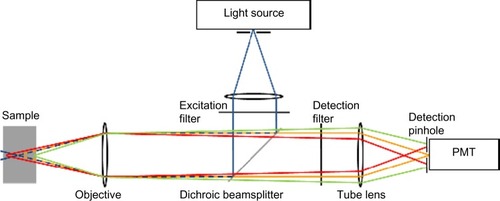
Figure 6 Schematic diagram of confocal microscopy principles.
Abbreviation: PMT, photomultiplier tube.