Figures & data
Figure 1 Voltage profiles of electrical activity in cat small intestinal smooth muscle.
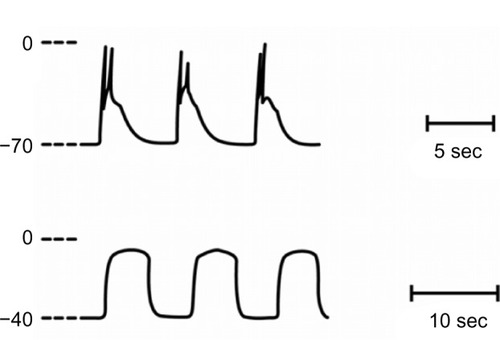
Figure 2 Recording from cat small intestinal muscle segment of mechanical (upper) and electrical (lower) activity in normal solution (A), 7 minutes after change to calcium-free solution (B), and 50 minutes after change to calcium-free solution (C). As shown in (C), prolonged potentials triggered contractions. Electrical recordings were made with pressure electrodes. Calibration bar: A/B, 0.4 mV, 0.8 g, 16 seconds; C, 0.27 mV, 0.13 g, 10 seconds. Reproduced with permission from Mangel AW, Nelson DO, Rabovsky JL, Prosser CL, Connor JA. Depolarization-induced contractile activity of smooth muscle in calcium-free solution. Am J Physiol. 1982;242(1):C36–C40.Citation8
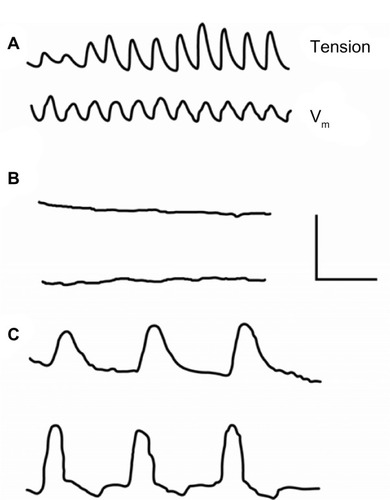
Figure 3 Recording of electrical activity from a segment of rabbit aorta. In the upper trace, recordings are made in normal solutions containing calcium. In the lower trace, fast rhythmic potentials become apparent after a change to calcium-free solution. Recordings are made with a pressure electrode. Calibration bar: 1 mV, 4 seconds. Reproduced with permission from Mangel A, van Breemen C. Rhythmic electrical activity in rabbit aorta induced by EGTA. J Exp Biol. 1981;90:339–342.Citation13
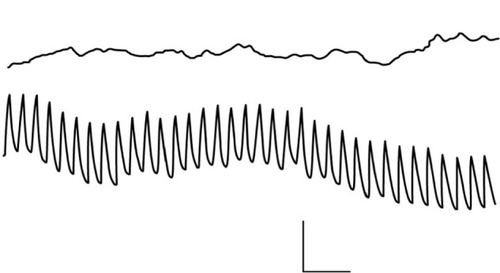
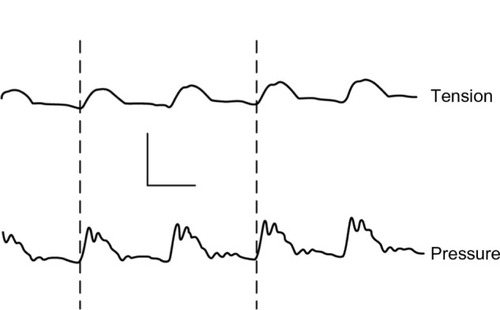
Figure 4 Simultaneous recording of tension (upper) and blood pressure (lower) from the rabbit aorta in vivo.