Figures & data
Figure 1 Major pathways involved in bilirubin production, conjugation, and excretion.
Abbreviations: ATP, adenosine triphosphate; CB, conjugated bilirubin; GI, gastrointestinal; UB, unconjugated bilirubin; UGT, uridine diphosphate glycosyltransferase; ??, the mechanism is unknown.
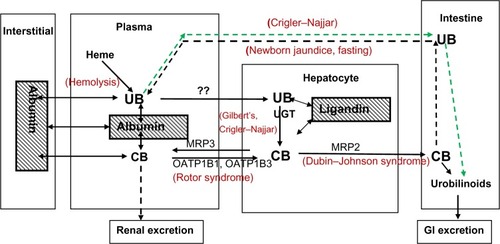
Table 1 Representative human plasma bilirubin values
Figure 2 Physiologically based theoretical prediction (PBPK) of plasma unconjugated bilirubin concentration following a bolus 14C dose.
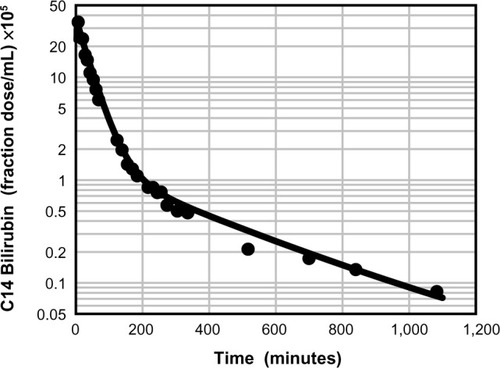
Figure 3 Physiologically based theoretical prediction model of the free (unbound) unconjugated bilirubin concentration in the vein (solid line), muscle (long dashed line), and skin (short dashed line) following a bolus 14C dose.
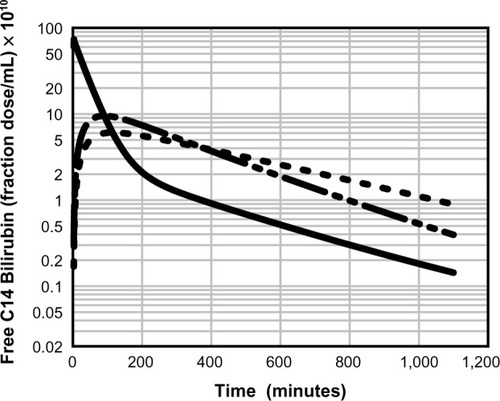
Figure 4 Estimated normal human total and free (unbound) conjugated and unconjugated bilirubin in the plasma, hepatocyte, and bile duct.
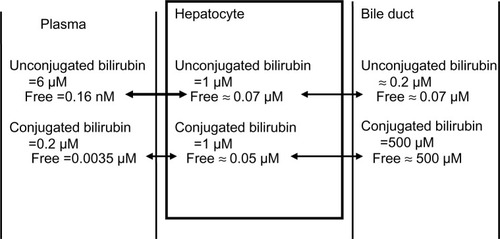
Figure 5 Role of OATP in CB homeostasis in normal subjects with a serum CB concentration of 0.012 mg/dL.
Abbreviations: CB, conjugated bilirubin; UB, unconjugated bilirubin; UGT, uridine diphosphate glycosyltransferase.
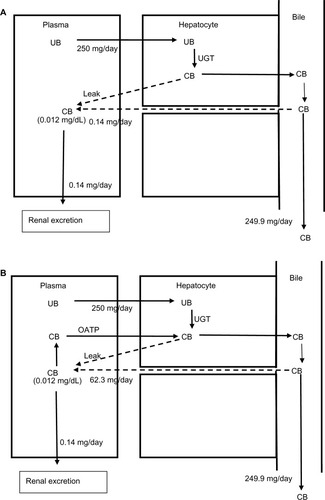
Figure 6 Role of OATP in CB homeostasis in a subject with hepatocellular disease and an elevated serum CB concentration of 0.36 mg/dL.
Abbreviations: CB, conjugated bilirubin; UB, unconjugated bilirubin; UGT, uridine diphosphate glycosyltransferase.

Figure 7 Processes involved in bile formation and bilirubin secretion.
Abbreviations: CB, conjugated bilirubin; UB, unconjugated bilirubin; UGT, uridine diphosphate glycosyltransferase.
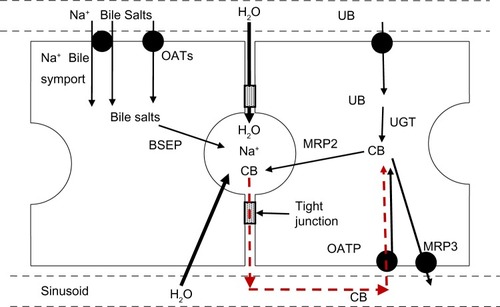
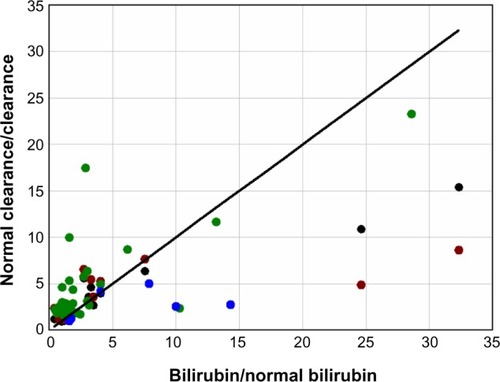
Figure 8 Plot of the fractional increase in total serum bilirubin (bilirubin/normal bilirubin) versus the inverse of the fractional decrease in the hepatic clearance (normal clearance/clearance) of indocyanine green (black), sulfobromophthalein (red), aminopyrine (green), and antipyrine (blue) in patients with chronic alcoholic cirrhosis.