
Figures & data
Table 1 Baseline demographics and characteristics of study participants
Table 2 Inter-item correlations and correlations with Constipation Severity (treatment period averages)
Table 3 Correlations between Constipation Relief and change in CC Symptom Severity Measures
Table 4 Correlations between change in PAC-QOL scores and change in CC Symptom Severity Measures
Figure 1 Illustration of the two-factor confirmatory factor analysis model for CC Symptom Severity Measures, with factor loadings.
Notes: The confirmatory factor analysis solution includes correlated residuals that are not shown between the following: CSBM Frequency and SBM Frequency, Straining and Stool Consistency, Abdominal Pain and Abdominal Discomfort.
Abbreviations: CC, chronic constipation; CSBM, complete spontaneous bowel movement; SBM, spontaneous bowel movement.
Abbreviations: CC, chronic constipation; CSBM, complete spontaneous bowel movement; SBM, spontaneous bowel movement.
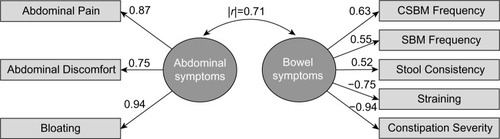
Table 5 Known-groups analyses – subgroup means on CC Symptom Severity Measures (treatment period average)
Table 6 Responsiveness analyses – subgroup mean changes on CC Symptom Severity Measures and effect sizes