
Figures & data
Table 1 Characterization of the study subjects
Table 2 Disease location, clinical and endoscopic activity indices, CRP, and fecal calprotectin values for patients with Crohn’s disease and those with ucerative colitis
Figure 1 AQP1 expression is reduced in the ileum of CD patients.
Abbreviations: 3D, three-dimensional; AQP, aquaporin; CD, Crohn’s disease; DAPI, 4′,6-diamidino-2-phenylindole; GAPDH, glyceraldehyde 3-phosphate dehydrogenase; ID, identification number; mRNA, messenger RNA; PDB, Protein Data Bank; UC, ulcerative colitis.
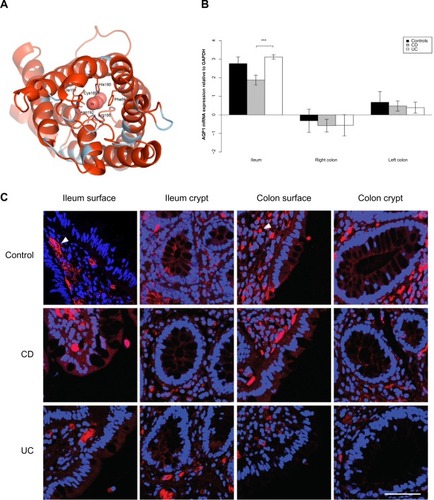
Figure 2 AQP3 expression is reduced in the ileum of CD patients.
Abbreviations: 3D, three-dimensional; AQP, aquaporin; CD, Crohn’s disease; DAPI, 4′,6-diamidino-2-phenylindole; GAPDH, glyceraldehyde 3-phosphate dehydrogenase; ID, identification number; mRNA, messenger RNA; PDB, Protein Data Bank; UC, ulcerative colitis.
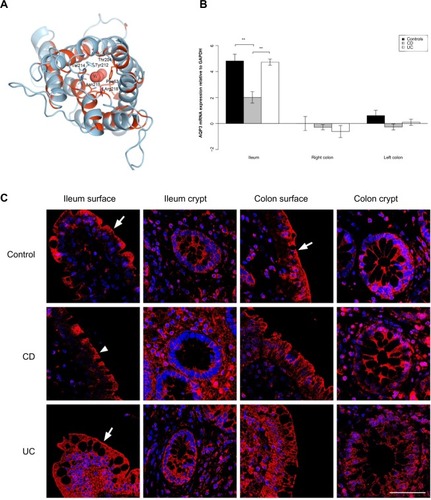
Figure 3 AQP7 expression is reduced in the ileum and colon of UC patients.
Abbreviations: 3D, three-dimensional; AQP, aquaporin; CD, Crohn’s disease; DAPI, 4′,6-diamidino-2-phenylindole; GAPDH, glyceraldehyde 3-phosphate dehydrogenase; ID, identification number; mRNA, messenger RNA; PDB, Protein Data Bank; UC, ulcerative colitis.
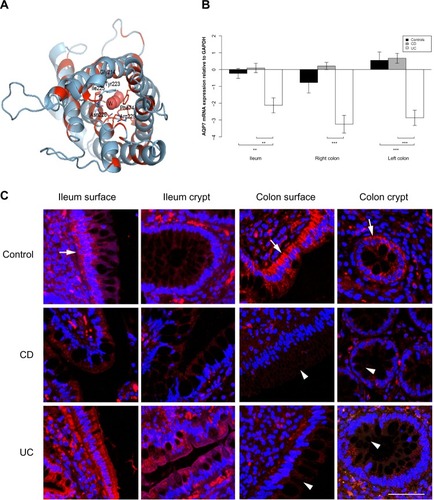
Figure 4 AQP8 expression is reduced in the ileum and colon of UC patients.
Abbreviations: 3D, three-dimensional; AQP, aquaporin; CD, Crohn’s disease; DAPI, 4′,6-diamidino-2-phenylindole; GAPDH, glyceraldehyde 3-phosphate dehydrogenase; ID, identification number; mRNA, messenger RNA; PDB, Protein Data Bank; UC, ulcerative colitis.
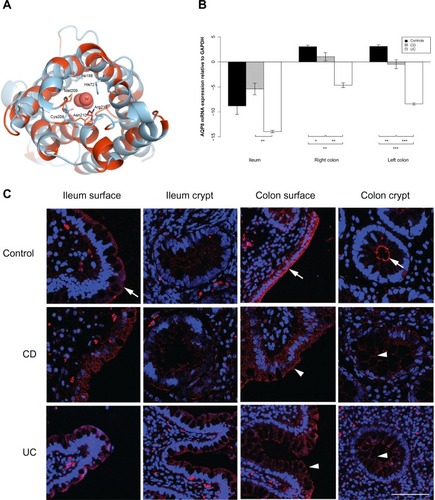
Table 3 Comparison of aquaporin mRNA levels in the small and large bowel biopsies from CD and UC patients and non-IBD patients controls
Table 4 Summary of the general trends in AQP expression detected by mRNA levels
Figure 5 Elevated COX-2 expression in UC and TNF-α and IL-23 expression in CD.
Abbreviations: CD, Crohn’s disease; UC, ulcerative colitis; GAPDH, glyceraldehyde 3-phosphate dehydrogenase; IL, interleukin; mRNA, messenger RNA; COX-2, cyclooxygenase 2; TNF-α, tumor necrosis factor-α.
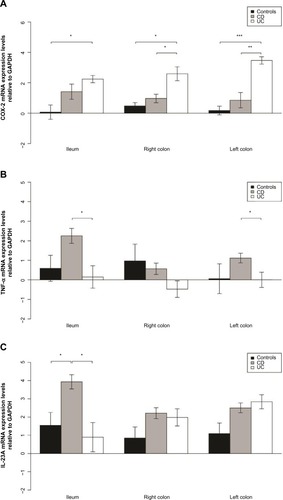
Table 5 Summary of key properties of AQPs
Figure S1 AQP expression in healthy human tissues.
Notes: The left panel (positive controls) shows micrographs with immunofluorescence labeling of human samples with AQP1, AQP3, and AQP7 antibodies. The tubular lumina are marked L. AQP1 is localized at the brush border and basolateral membranes of the renal proximal tubule (arrow, upper panel), AQP3 is localized at the basolateral membranes of the collecting ducts (arrowheads, middle panel) and AQP7 is localized at the plasma membrane of dipocytes (arrow, lower panel). The right panel (negative controls) shows sections from the same tissue as in the left panel, treated the same way, in absence of the primary antibody. No labeling is observed, excluding nonspecific labeling with the secondary antibodies. Scale bar: 50 μm.
Abbreviation: AQP, aquaporin.
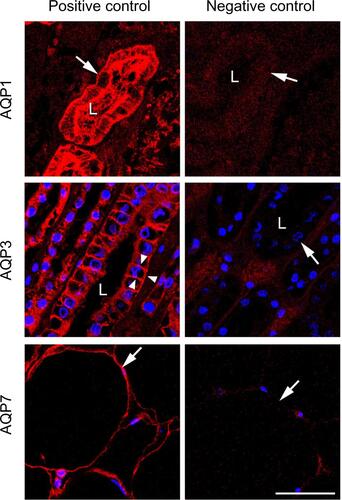
Table S1 TaqMan gene expression assays employed to monitor aquaporin expression
Table S2 Comparison of aquaporin mRNA levels in the small and large bowel biopsies from CD and UC patients and non-IBD patient controls
Table S3 Comparison of aquaporin mRNA levels from CD and UC patients and non-IBD patient controls in the small and large bowel biopsies