Figures & data
Figure 1 Delayed elevations of circulating E2 and ERα expression after PH were observed in the ORC and OVX mice.
Notes: (A and B) PH increased circulating E2 concentrations. Sham-operated control (male mice, A, open squares; female mice, B, open circles), ORC (A, gray inverted triangles with dotted lines), and the OVX (B, filled triangles with dotted lines) B6 mice underwent PH operations, and the concentrations of E2 were analyzed. The values are expressed as the mean ± SEM (n=5). *P<0.05. (C) Possible model of the PH-induced E2 production.
Abbreviations: E2, estradiol; ERα, estrogen receptor α; PH, partial hepatectomy; ORC, orchiectomy; OVX, ovariectomy; SEM, standard error of the mean.
Abbreviations: E2, estradiol; ERα, estrogen receptor α; PH, partial hepatectomy; ORC, orchiectomy; OVX, ovariectomy; SEM, standard error of the mean.
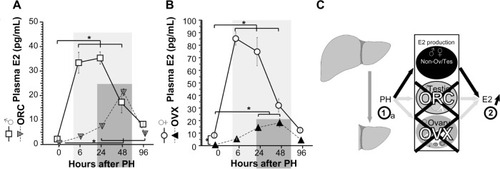
Figure 2 The estrous cycle regulated E2 concentration and hepatocyte proliferation.
Notes: (A) Both of hepatocyte proliferation (left y-axis, BrdU-positive hepatocytes, and the open hexagons with dotted lines) and the circulating concentration of E2 (right y-axis and the filled triangle) were increased in an E2 dose of 0 (Veh), 1, 3, 10, 30, and 100 mg/30 g body weight. The values are expressed as the mean ± SEM (n=5). *P<0.05. (B) The estrous cycle regulated E2 concentration (right y-axis and the filled rectangles) and hepatocyte proliferation (left y-axis, BrdU-positive hepatocytes, and the open circle). The values are expressed as the mean ± SEM (n=5). *P<0.05. (C) Possible model of the estrous cycle regulated hepatocyte proliferation.
Abbreviations: E2, estradiol; BrdU, bromodeoxyuridine; SEM, standard error of the mean.
Abbreviations: E2, estradiol; BrdU, bromodeoxyuridine; SEM, standard error of the mean.
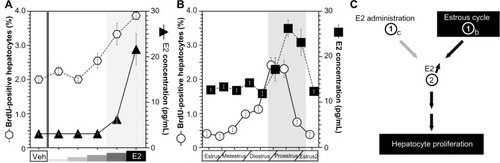
Figure 3 SERM administration regulated hepatocyte proliferation.
Notes: (A) E2 administration induced hepatocyte proliferation. Vehicle (column 1, Veh, EtOH, open bar), E2 (column 2, black bar), or ICI (column 3, light gray bar) were injected at doses of 100 mg/30 g body weight. BrdU was injected, and the labeled hepatocytes were counted. The values are expressed as the mean ± SEM (n=7). *P<0.05. (B) DPN administration induced hepatocyte proliferation. Vehicle (open squares with dotted lines, Veh, EtOH), 1 µM E2 (filled diamonds), 1 µM PPT (dark gray triangles), and 1 µM DPN (light gray circles with dotted lines) were administrated to Hep G2 cells, and the cell numbers were counted at Day 0 (D0), 4 (D4), 7 (D7), and 10 (D10). (C) Summary of results of drugs in and . The values are expressed as the mean ± SEM (n=5). *P<0.05.
Abbreviations: SERM, selective estrogen receptor modulator; E2, estradiol; ICI, ICI182780; BrdU, bromodeoxyuridine; GPR, G protein-coupled receptor; ERα, estrogen receptor α; ERβ, estrogen receptor β; SEM, standard error of the mean; DPN, 2,3-bis(4-hydroxyphenyl)propionitrile; PPT, 4,4′,4′-(4-propyl-[1H]-pyrazole-1,3,5-triyl)trisphenol.
Abbreviations: SERM, selective estrogen receptor modulator; E2, estradiol; ICI, ICI182780; BrdU, bromodeoxyuridine; GPR, G protein-coupled receptor; ERα, estrogen receptor α; ERβ, estrogen receptor β; SEM, standard error of the mean; DPN, 2,3-bis(4-hydroxyphenyl)propionitrile; PPT, 4,4′,4′-(4-propyl-[1H]-pyrazole-1,3,5-triyl)trisphenol.
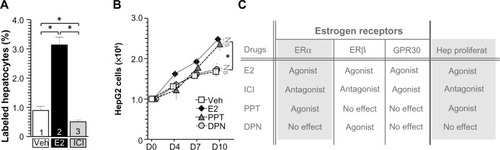
Figure 4 PH induced ERα expression in the hepatocyte of periportal area.
Notes: PH-stimulated ERα expression in the periportal hepatocytes. After the PH operations, the livers were removed from these mice. ERα expression levels were analyzed with RT-PCR (A) and ISH (B). (A) The liver RNAs of the control (lanes 2, 7, and 10), PH (2-h lane 4, 8-h lanes 5, 9, and 11, 24-h lanes 6 and 12), the E2-injected mice (lanes 7, 8, and 9), and OVX (lanes 10, 11, and 12) were extracted, and RT-PCR was performed. (B) The livers were removed from the control (a), the PH (b), and the OVX-PH (c) mice. ISH was performed using ERα probes. Scale bars =1 mm. The white arrows indicated portal veins.
Abbreviations: PH, partial hepatectomy; ERα, estrogen receptor α; RT-PCR, reverse transcription polymerase chain reaction; ISH, in situ hybridization; OVX, ovariectomy; E2, estradiol; HPRT, hypoxanthine-guanine phosphoribosyltransferase.
Abbreviations: PH, partial hepatectomy; ERα, estrogen receptor α; RT-PCR, reverse transcription polymerase chain reaction; ISH, in situ hybridization; OVX, ovariectomy; E2, estradiol; HPRT, hypoxanthine-guanine phosphoribosyltransferase.
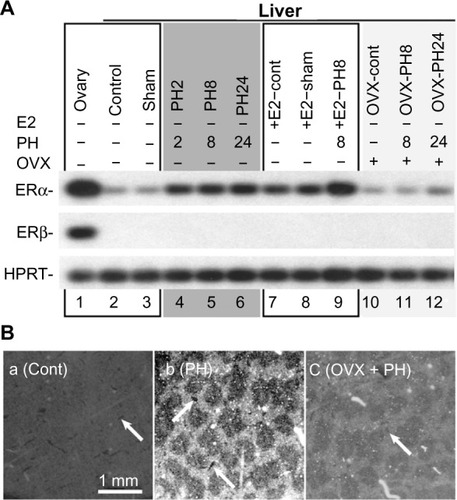
Figure 5 OVX did not affect liver weight recovery after PH, and the hepatocyte proliferations were delayed.
Notes: (A) The time course of the OVXs and PHs are illustrated in B–D. (B and C) Control (Cont) and OVX B6 female mice underwent PH operations; the liver weight recovery (B) and hepatocyte proliferation were analyzed by BrdU-IHC (C). The values are expressed as the mean ± SEM (n=5–9). *P<0.05. (D) The livers were prepared after PH at the indicated times, and the BrdU-positive hepatocytes were counted. The values are expressed as the mean ± SEM (n=5–7). *P<0.05.
Abbreviations: OVX, ovariectomy; PH, partial hepatectomy; BrdU-IHC, bromodeoxyuridine immunohistochemistry; SEM, standard error of the mean; NS, nonsignificant; OPE, operation.
Abbreviations: OVX, ovariectomy; PH, partial hepatectomy; BrdU-IHC, bromodeoxyuridine immunohistochemistry; SEM, standard error of the mean; NS, nonsignificant; OPE, operation.
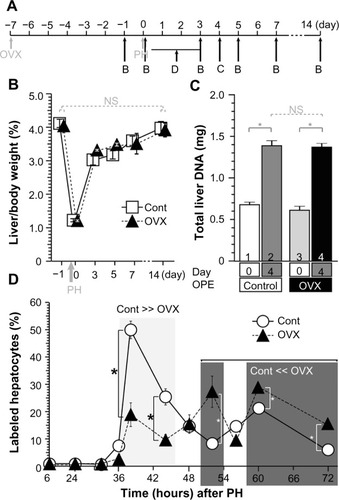
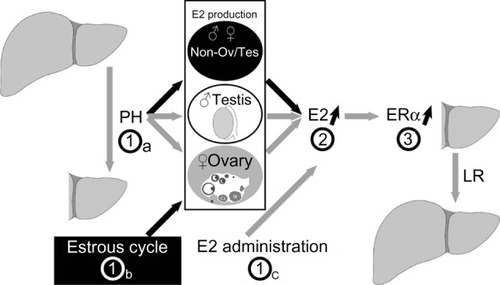
Figure 6 Model of hepatocyte proliferation in female mice.
Notes: PH (step 1a), the estrous cycle (step 1b), and E2 injection (step 1c) increased E2 concentrations (step 2), and ERα expression in the periportal hepatocytes was stimulated (step 3), which resulted in hepatocyte proliferation and LR.
Abbreviations: PH, partial hepatectomy; E2, estradiol; ERα, estrogen receptor α; LR, liver regeneration.
Abbreviations: PH, partial hepatectomy; E2, estradiol; ERα, estrogen receptor α; LR, liver regeneration.