
Figures & data
Table 1 Unit costs 2013–2014 prices (PLN)
Figure 1 Expected probability of infants developing tolerance to cow’s milk by 18 months after starting a formula.
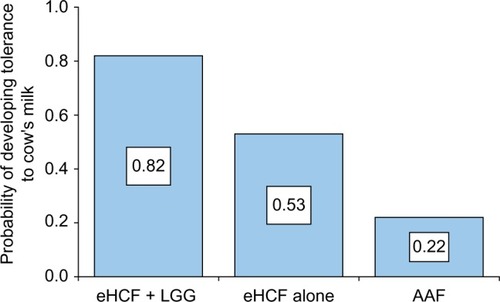
Table 2 Expected levels of health care resource use and corresponding costs at 2013–2014 prices over 18 months from starting a formula
Table 3 Cost-effectiveness of eHCF + LGG versus eHCF alone and eHCF + LGG versus AAF
Table 4 Cost-effectiveness of eHCF + LGG versus eHCF alone and eHCF + LGG versus AAF, stratified by IgE status
Figure 2 Distribution of expected NFZ costs over 18 months from starting a formula and expected probability of developing tolerance to cow’s milk by 18 months, generated by 10,000 iterations of the model.
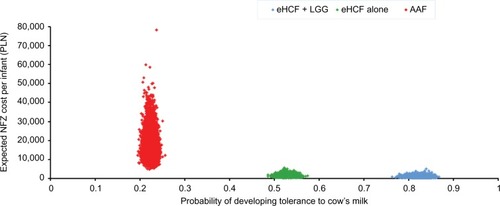
Figure 3 Distribution of expected parent costs over 18 months from starting a formula and expected probability of developing tolerance to cow’s milk by 18 months, generated by 10,000 iterations of the model.
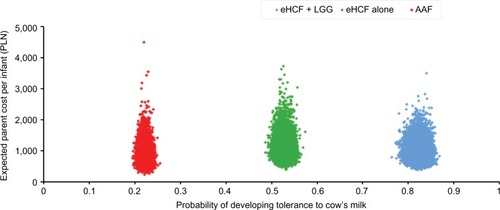
Figure 4 Probability of being cost-effective at different cost-effectiveness thresholds, from the NFZ’s perspective.
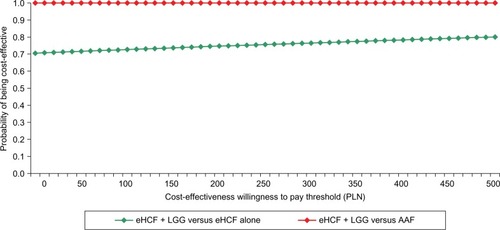
Figure 5 Probability of being cost-effective at different cost-effectiveness thresholds, from the parents’ perspective.
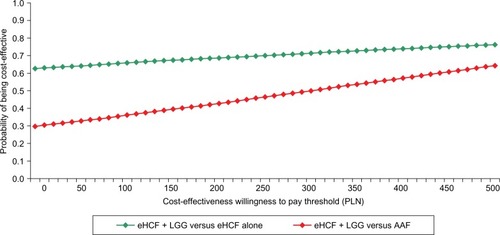
Table 5 Sensitivity analyses