
Figures & data
Figure 1 Patient distribution by biologic drug at baseline.
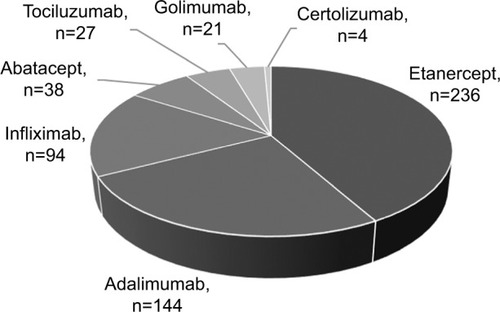
Table 1 Baseline demographic, therapeutic and clinical characteristics of patients enrolled in the study
Figure 2 Persistence with biologic therapy: adalimumab, etanercept and infliximab.
Abbreviations: Eta, etanercept; Ada, adalimumab; Inf, infliximab.
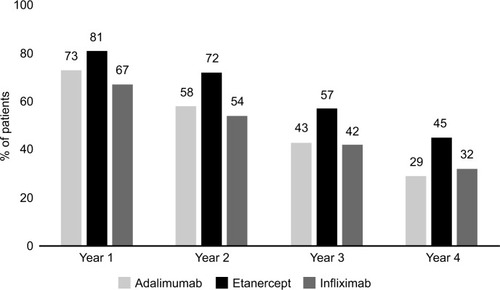
Figure 3 Percentage of patients switching from initial therapy.
Abbreviations: Eta, etanercept; Ada, adalimumab; Inf, infliximab.
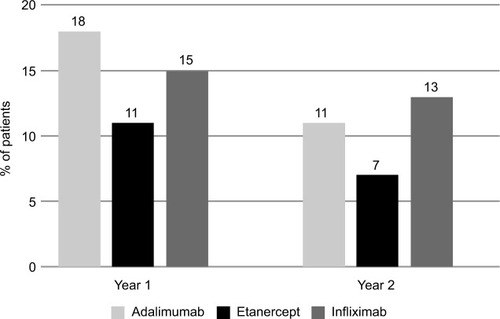
Figure 4 Percentage of patients with drug consumption escalation.
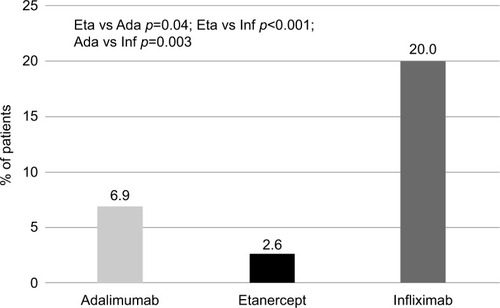
Figure 5 Percentage of patients with drug consumption reduction.
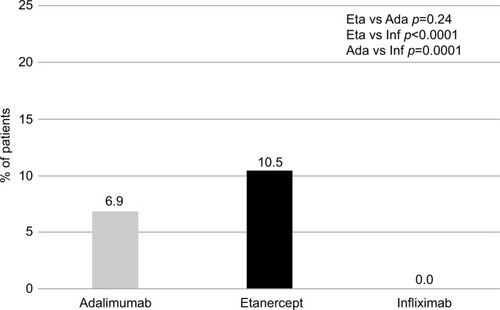
Table 2 Multivariable logistic regression model of persistence to therapy and switching among biologic agents
Figure 6 Costs for the three biologics investigated*.
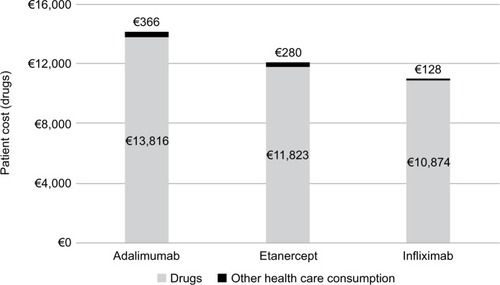
Figure 7 Costs for other health care consumption (excluding drugs).
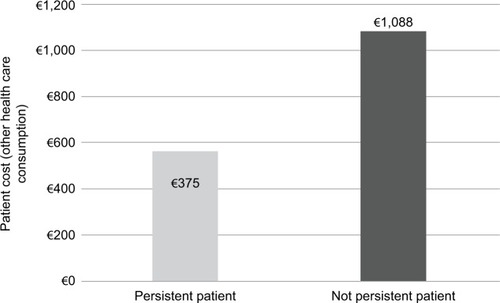
Table 3 Mean annual costs of treatment per indicator of pharmacological consumption.
Table 4 Cost of illness, generalized linear model