
Figures & data
Figure 1 Model structure.
Abbreviations: BSC, best supportive care; TWSTRS, Toronto Western Spasmodic Torticollis Rating Scale.
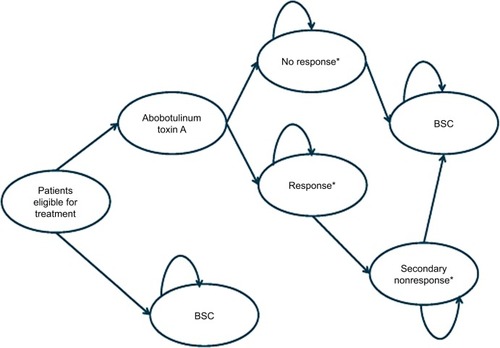
Figure 2 Graphical representation of linkage between utility and TWSTRS estimated from analysis of abobotulinumtoxinA trial. Data extrapolated from a previous study.Citation25
Abbreviation: TWSTRS, Toronto Western Spasmodic Torticollis Rating Scale.
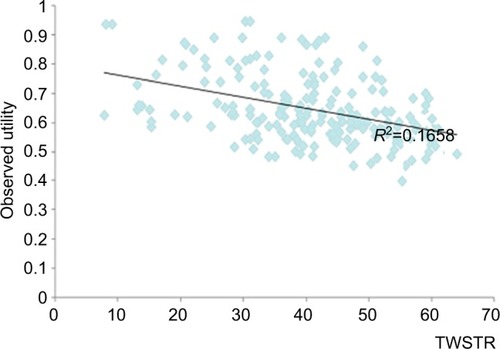
Table 1 Discounted costs and health outcomes in base-case analysis
Table 2 Direct and indirect costs (please refer to for further details on the base-case model inputs)
Table 3 Alternative scenario results: abobotulinumtoxinA compared to BSC
Figure 3 Cost-effectiveness planes of incremental costs per QALY of abobotulinumtoxinA versus BSC.
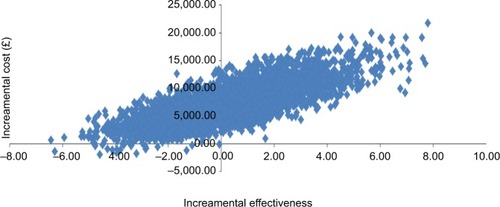
Figure 4 Cost-effectiveness acceptability curves of abobotulinumtoxinA and BSC without toxins injections.
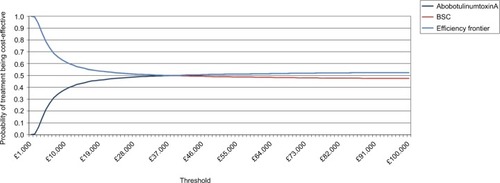
Figure S1 Illustration of QALY gain in first (A) and subsequent cycle (B) when TWSTRS is assumed to have residual benefit at week 12.
Abbreviations: QALYs, quality-adjusted life-years; TWSTRS, Toronto Western Spasmodic Torticollis Rating Scale.
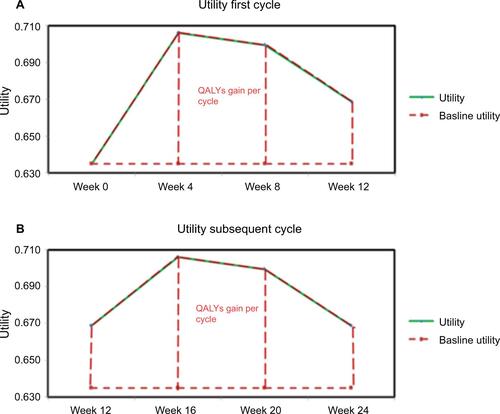
Figure S2 Tornado diagram of one-way sensitivity analysis on incremental cost.
Abbreviations: BSC, best supportive care; BoNT-A, botulinum neurotoxin type A.
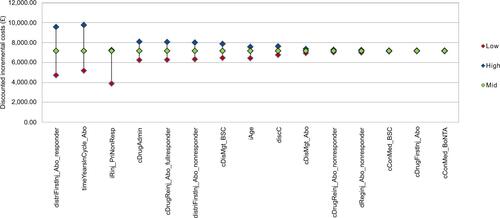
Figure S3 Tornado diagram of one-way sensitivity analysis on incremental benefit.
Abbreviations: BSC, best supportive care; QALY, quality-adjusted life-year; TWS, Toronto Western Spasmodic.
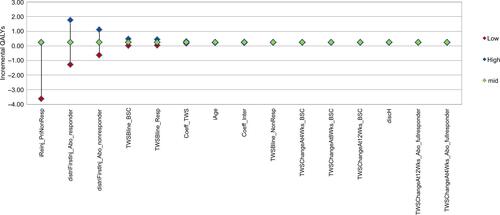
Figure S4 Tornado diagram of one-way sensitivity analysis on ICER.
Abbreviations: BSC, best supportive care; ICER, incremental cost-effectiveness ratio; TWS, Toronto Western Spasmodic.
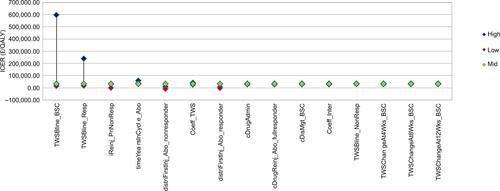
Figure S5 Tornado diagram of one-way sensitivity analysis on incremental net benefit with a willingness-to-pay threshold of £20,000/QALY.
Abbreviations: BSC, best supportive care; INB, incremental net benefit; QALY, quality-adjusted life-year; TWS, Toronto Western Spasmodic.
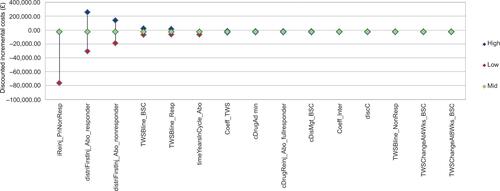
Table S1 Model inputs
Table S2 Estimates of statistical model linking utility and TWSTRS based on analysis of abobotulinumtoxinA trial
Table S3 Parameters included in one-way sensitivity analysis
Table S4 Parameters included in probabilistic sensitivity analysis
Table S5 Alternative scenario results: other comparisons