
Figures & data
Figure 1 (A) Participant flow chart. (B) Schematic of study design.
Notes: *The initiation of the second drug in the combination therapy (eg, insulin plus GLP-1, or GLP-1 plus insulin) is defined as the index event, with the corresponding date as the index date. To ensure that patients received combination therapy after the index date, they were required to have ≥14 days of overlap for both therapies in the 90 days after the index date.
Abbreviations: T2D, type 2 diabetes; GLP-1, glucagon-like peptide-1.
Abbreviations: T2D, type 2 diabetes; GLP-1, glucagon-like peptide-1.
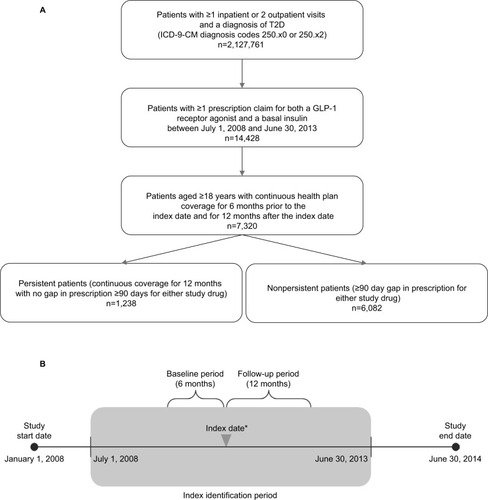
Table 1 Baseline demographic and clinical characteristics
Figure 2 Kaplan–Meier curve of median time to discontinuation of combination therapy.
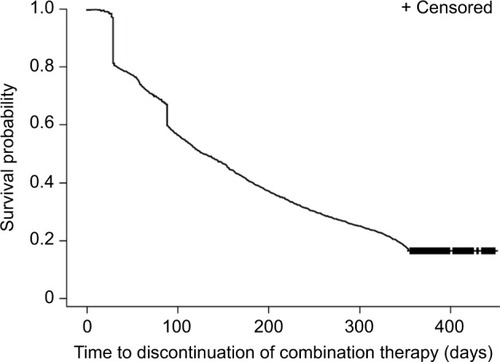
Table 2 Health care utilization in the 12-month follow-up period
Figure 3 All-cause (A) and diabetes-related (B) health care costs over the 12 months of follow-up.
Abbreviation: ED, emergency department.
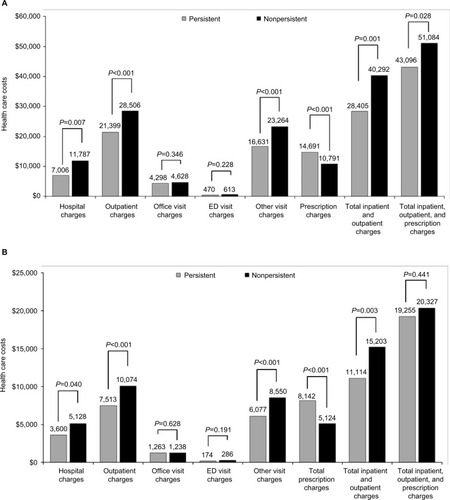
Table 3 Predictors of A1C change