
Figures & data
Table 3 Annual transition probabilities
Table 1 Baseline characteristics of patient population
Table 2 SVR values applied in the model
Table 4 Utilities and costs used in the model
Table 5 Discounted base case results for treatment-experienced patients (F3/F4)
Figure 1 Univariate sensitivity analysis: testing versus no testing.
Abbreviations: DCC, decompensated cirrhosis; HCC, hepatocellular carcinoma; ICER, incremental cost-effectiveness ratio; LDV, ledipasvir; NS5A, nonstructural protein 5A; SMV, simeprevir; SOF, sofosbuvir; SVR, sustained virologic response; TP, transition probability; Util, utility.
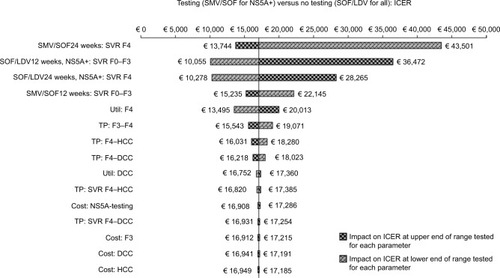
Figure 2 Probabilistic sensitivity analysis: two-way cost-effectiveness acceptability curve.
Abbreviations: LDV, ledipasvir; NS5A, nonstructural protein 5A; SMV, simeprevir; SOF, sofosbuvir.
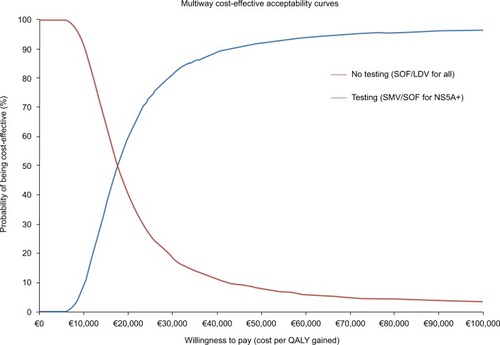
Table 6 Results of scenario analyses