
Figures & data
Figure 1 Decision tree model.
Note: 1- Represents the complementary probability.
Abbreviations: AE, adverse event; ANI, anidulafungin; pAEV, probability of AEs occurring with VOR monotherapy; pAEVA, probability of AEs occurring with VOR+ANI combination therapy; pMV, probability of mortality with VOR monotherapy; pMVA, probability of mortality with VOR+ANI combination therapy; pSAEV, probability of serious AEs occurring with VOR monotherapy; pSAEVA, probability of serious AEs occurring with VOR+ANI combination therapy; VOR, voriconazole.
Abbreviations: AE, adverse event; ANI, anidulafungin; pAEV, probability of AEs occurring with VOR monotherapy; pAEVA, probability of AEs occurring with VOR+ANI combination therapy; pMV, probability of mortality with VOR monotherapy; pMVA, probability of mortality with VOR+ANI combination therapy; pSAEV, probability of serious AEs occurring with VOR monotherapy; pSAEVA, probability of serious AEs occurring with VOR+ANI combination therapy; VOR, voriconazole.
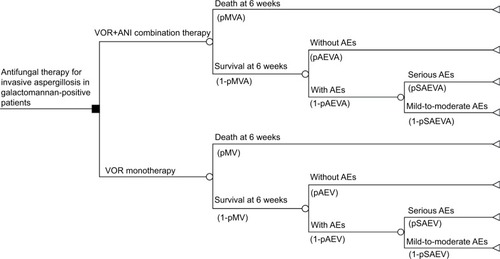
Table 1 Economic model assumptions
Table 2 Drug acquisition cost calculation
Table 3 Deterministic analysis results: base-case
Figure 2 Tornado plot (deterministic sensitivity analysis).
Abbreviations: AE, adverse event; ANI, anidulafungin; EV, expected value of incremental cost-effectiveness ratio (€15,784.84 per LYG); LYG, life-year gained; VOR, voriconazole.
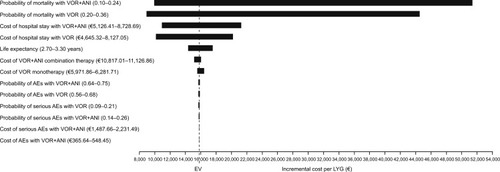
Figure 3 Cost-effectiveness plane (Monte Carlo simulation) at: (A) a willingness-to-pay threshold of €30,000; and (B) a willingness-to-pay threshold of €45,000.
Abbreviations: ANI, anidulafungin; LYG, life-year gained; VOR, voriconazole; WTP, willingness-to-pay threshold.
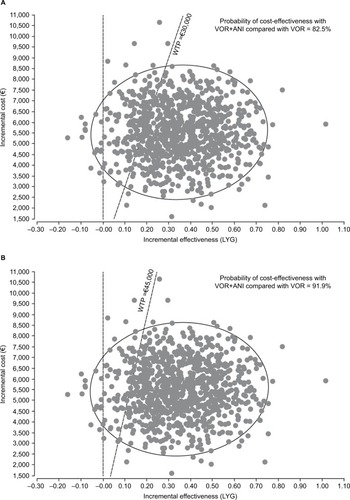
Figure 4 Cost-effectiveness acceptability curve.
Abbreviations: ANI, anidulafungin; VOR, voriconazole.
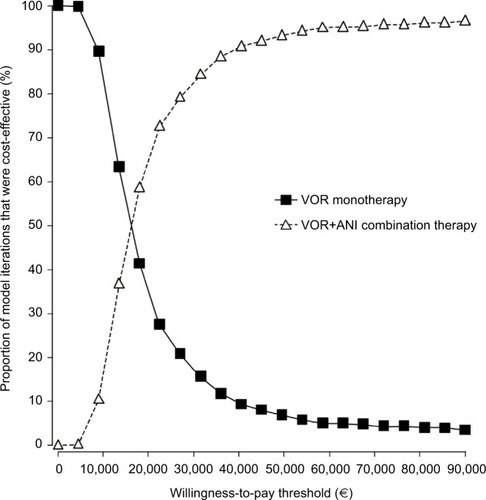
Table 4 Probabilistic analysis results