Figures & data
Table 1 Descriptive statistics at the patient level or treatment period level
Figure 1 Survival times – discontinuation due to inefficacy by drug.
Abbreviations: ADA, adalimumab; CTZ, certolizumab pegol; ETA, etanercept; GOL, golimumab; INF, infliximab; RTX, rituximab; TCZ, tocilizumab.
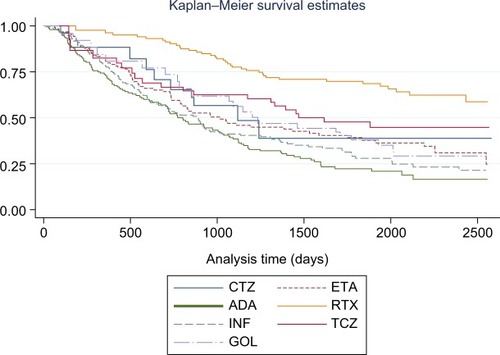
Table 2 Cox regression – hazard ratios of discontinuation due to inefficacy, to adverse events, and to any reason
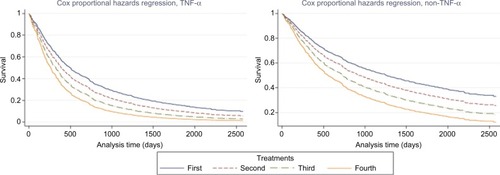
Figure 2 Cox-regression-predicted survival times – discontinuation due to any reason, by number of treatment, and TNF-α.
Notes: Fixed variables and their values: rheumatoid factor=0, anti-cyclic citrullinated peptide antibodies=0, steroid=0, sDMARD=1, disease years=13, and gap longer than a month=0.
Abbreviations: sDMARD, synthetic disease-modifying antirheumatic drug; TNF-α, tumor necrosis factor-alpha.
Abbreviations: sDMARD, synthetic disease-modifying antirheumatic drug; TNF-α, tumor necrosis factor-alpha.