
Figures & data
Figure 1 Structure of the budget impact model.
Abbreviations: ATV, atazanavir; NRTI, nucleoside reverse transcriptase inhibitor; EVG, elvitegravir; c, cobicistat; TDF, tenofovir; FTC, emtricitabine; r, ritonavir; 3TC, lamivudine.
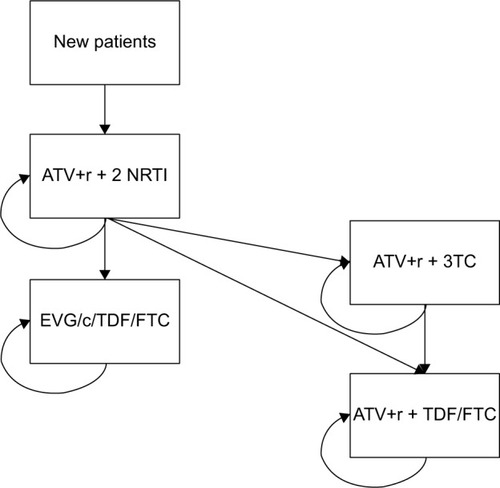
Table 1 Number of patients switched to dual therapy per year in each scenario
Table 2 Per capita annual costs considered in the model
Table 3 Patient distribution among different ART
Table 4 Results of the budget impact analysis