
Figures & data
Figure 1 Attrition and inclusion of the study sample.a
Abbreviations: DMT, disease-modifying therapy; MS, multiple sclerosis.
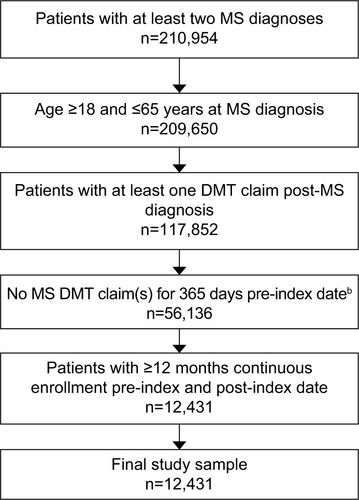
Table 1 DMTs for MS included in the retrospective claims database analysisTable Footnotea
Table 2 Baseline demographic and clinical characteristics of study sample (n=12,431)
Table 3 Differences in adherence, discontinuation, and switches between patients with MS initiating oral and injectable DMTs in the US
Table 4 Logistic regression analysis: predictors of adherence to index DMT (PDC ≥0.8)
Table 5 Logistic regression analysis: predictors of MS relapse
Table 6 Predictors of MS-related hospital visits, ER visits, and outpatient visits in patients with MS treated with DMTs (n=12,431)
Figure 2 Predicted mean non-drug medical costs for MS patients adherent (PDC ≥0.8) and non-adherent (PDC <0.8) to index DMT (total n=12,431).
Abbreviations: MS, multiple sclerosis; PDC, proportion of days covered; DMT, disease-modifying therapy; ER, emergency room.
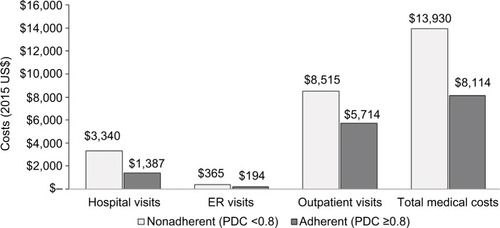
Table 7 Generalized linear regression analysis: predictors of non-drug medical costs in patients with MS on DMT (total n=12,431)Table Footnotea