Figures & data
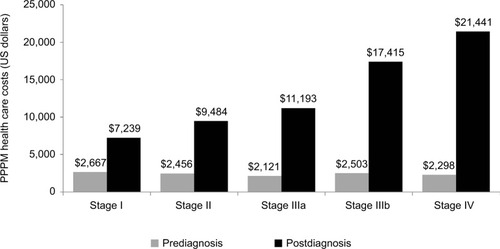
Figure 1 Patient selection and inclusion.
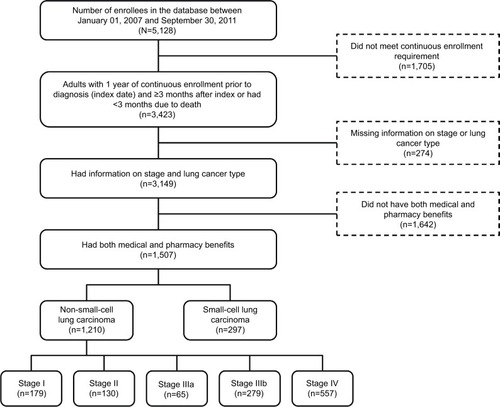
Figure 2 Kaplan–Meier survival curves of mortality by stage of disease.
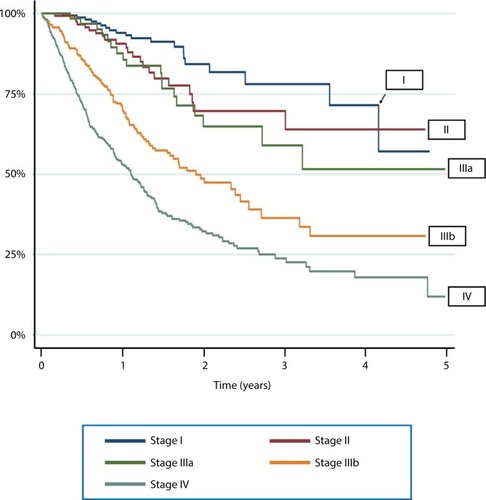
Table 1 Characteristics of all NSCLC patients at baseline and by cancer stage
Table 2 Summary of diagnostic testing in 12 months prior to the date of diagnosis
Table 3 Health care utilization rates and per-member per-month costs in the NSCLC cohort pre- and postdiagnosis
Figure 3 Comparison of per-patient per-month (PPPM) total health care costs pre- and postdiagnosis for non-small-cell lung carcinoma patients.