
Figures & data
Figure 1 Distribution of patient counts by missed treatment rate and cause.
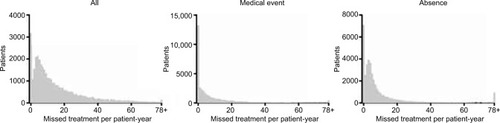
Table 1 Missed treatments by cause during 2012
Table 2 Comparison of baseline patient characteristics by attendance status: pre-match
Table 3 Comparison of baseline patient characteristics by attendance status: post-match
Figure 2 Rates of hospitalization and mortality by attendance status.
Abbreviations: CI, confidence interval; IRR, incidence rate ratio.
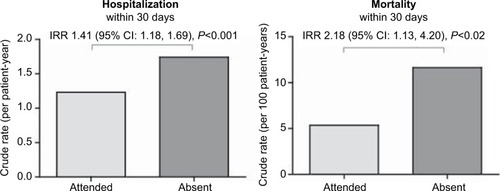
Figure S1 Rates of hospitalization and death by attendance status (180-day outcome period).
Notes: The crude rates (per patient-year) of hospitalization (left panel) and mortality (right panel) within 180 days of the index treatment are presented; the rate for patients who attended the treatment is presented in light gray, whereas the rate for those who were absent from the treatment (ie, did not attend and did not have a documented medical event on the day of the missed treatment) is presented in dark gray. The adjusted IRR (95% CI) referent to patients who did attend the treatment is presented at the top of each panel.
Abbreviations: CI, confidence interval; IRR, incidence rate ratio.
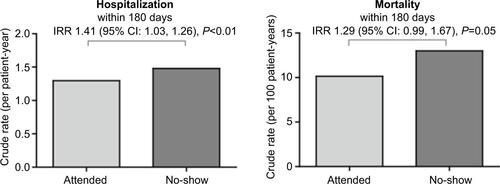
Table S1 Hospitalizations that led to a missed treatment by CCS level 1 categories
Table S2 Overall comparison of short-term (30-day) and long-term (180-day) secondary outcomes by attendance status