
Figures & data
Figure 1 Overview of model structure depicting transition from pre-progression to post-progression and death health states.
Abbreviations: PFS, progression-free survival; OS, overall survival; S(t), survival function (probability of survival beyond time t); t, time.
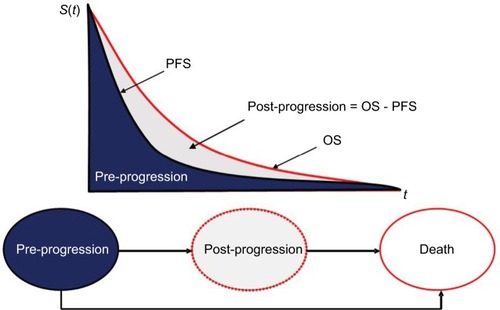
Table 1 Proportion of patients who experienced grade 3 and 4 AE for each treatment arm
Table 2 Clinical and cost-effectiveness outcomes
Table 3 Breakdown of costs
Figure 2 Tornado diagram of DSA results.
Abbreviations: DSA, deterministic sensitivity analysis; QALY, quality-adjusted life year.
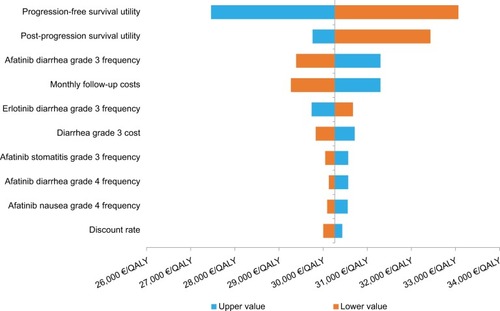
Figure 3 PSA outcomes, cost-effectiveness plane.
Note: Willingness-to-pay (cost per QALY) for afatinib.
Abbreviations: PSA, probabilistic sensitivity analysis; QALY, quality-adjusted life year.
Abbreviations: PSA, probabilistic sensitivity analysis; QALY, quality-adjusted life year.
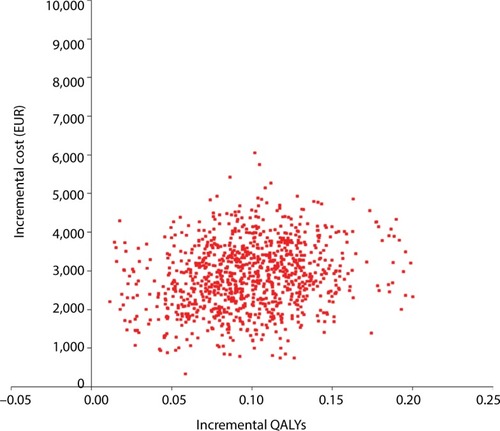
Figure 4 PSA outcomes, cost-effectiveness acceptability curve.
Note: Willingness-to-pay (cost per QALY) for afatinib versus erlotinib.
Abbreviations: PSA, probabilistic sensitivity analysis; QALY, quality-adjusted life year.
Abbreviations: PSA, probabilistic sensitivity analysis; QALY, quality-adjusted life year.
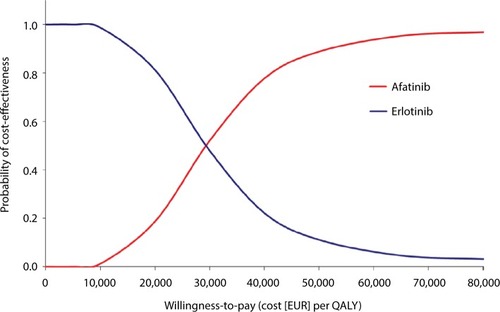
Table S1 Drug acquisition costs
Table S2 Unit costs of resources
Table S3 Parameters included in the DSA
Table S4 Summarized results from the additional sensitivity analyses in comparison to the base case
Table S5 ICER for low and high values for parameters included in the DSA