
Figures & data
Table 1 Simplified iron isomaltoside dosing table used in the reference case analysis showing the total recommended iron dose by bodyweight and hemoglobin concentration and the proportions of patients falling into each category
Figure 1 Histograms of bodyweight and hemoglobin distributions in the base case analysis illustrated using a bodyweight bin size of 1 kg (A) and a hemoglobin bin size of 0.5 g/dL (B).
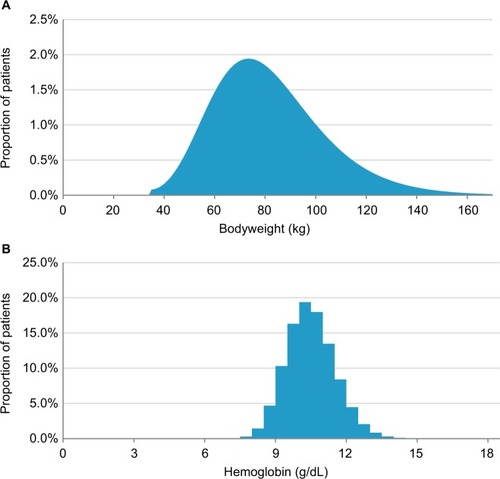
Figure 2 Mean number of infusions per patient (A) and proportion of patients requiring multiple infusions (B).
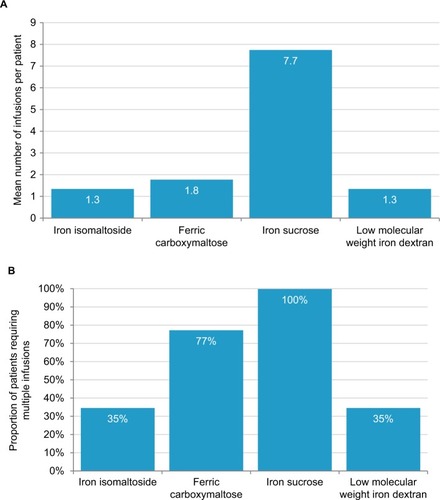
Table 2 Base case budget impact outcomes expressed as the cost per treated patient per year
Figure 3 Cost savings with iron isomaltoside relative to iron sucrose (A) and ferric carboxymaltose (B) over a range of mean bodyweights in an average clinical commissioning group.
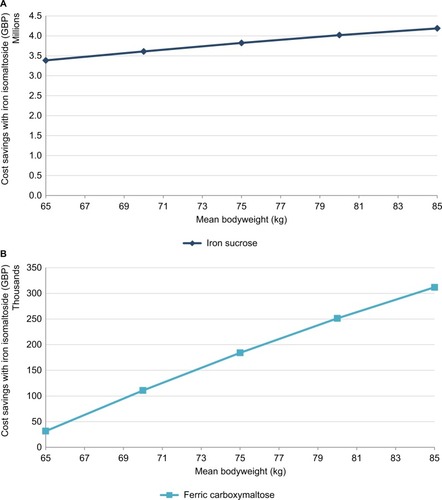
Table 3 One-way sensitivity analyses around the base case analysis