Figures & data
Figure 1 Model structure of transition probabilities.
Abbreviation: ICU, intensive care unit.
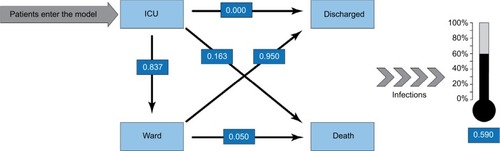
Table 1 Probabilities of ICU patients’ outcomes and mean lengths of stay for patients receiving standard parenteral nutrition.
Figure 2 Infections: random effects meta-analysis and Forest plot for parenteral nutrition including omega-3 fatty-acid-enriched lipid emulsion vs standard parenteral nutrition not containing omega-3 fatty acids.
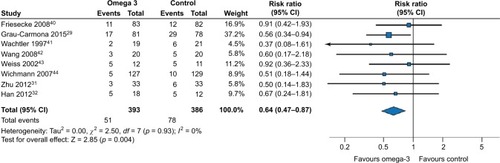
Figure 3 Length of intensive care unit stay: random effects meta-analysis and Forest plot for parenteral nutrition including omega-3 fatty-acid-enriched lipid emulsion vs standard parenteral nutrition not containing omega-3 fatty acids.
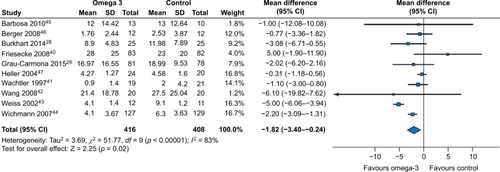
Figure 4 Post-intensive care unit length of hospital stay: random effects meta-analysis and Forest plot for parenteral nutrition including omega-3 fatty-acid-enriched lipid emulsion vs standard parenteral nutrition not containing omega-3 fatty acids.
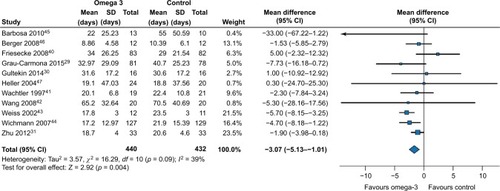
Table 2 Mean clinical outcome parameter results from model simulations
Table 3 Results of the cost-effectiveness analysis: mean costs per patient (standard deviation)
Figure 5 Scatterplot of the results of the probabilistic sensitivity analysis for parenteral nutrition including omega-3 fatty-acid-enriched lipid emulsions vs standard parenteral nutrition not containing omega-3 fatty acids.
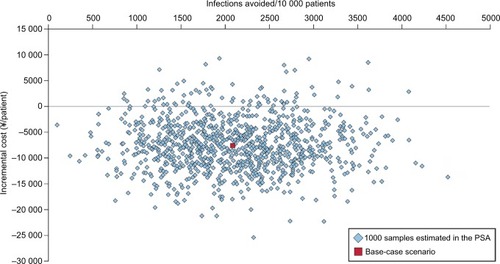
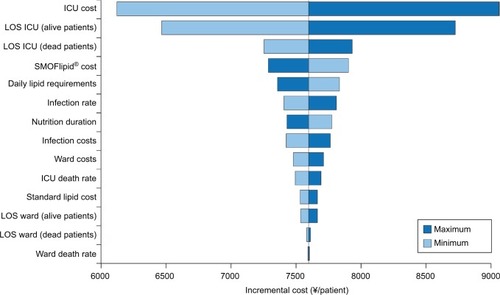
Figure 6 Tornado plot of deterministic sensitivity analysis results on the difference in total cost (¥) between standard parenteral nutrition not containing omega-3 fatty acids minus parenteral nutrition with omega-3 fatty-acid-enriched lipid emulsions.