
Figures & data
Table 1 Attrition table for study cohort
Table 2 Group means and counts for model variables by sUA goal attainment
Table 3 Parameter estimates for multivariate model of sUA goal attainment (logistic model) in the training sample
Table 4 Parameter estimates for multivariate linear model of sUA in the training sample
Figure 1 ROC curves for the logistic model: training and validation samples.
Abbreviation: ROC, receiver operator characteristic.
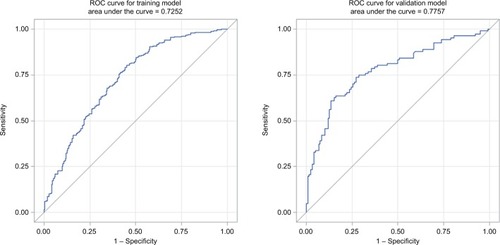
Table 5 Performance measures for predicting sUA goal attainment
Table S1 Baseline demographics for training and validation samples
Table S2 Baseline clinical characteristics for training and validation samples