
Figures & data
Figure 1 Cost utility decision tree model structure adaptation for Thailand.
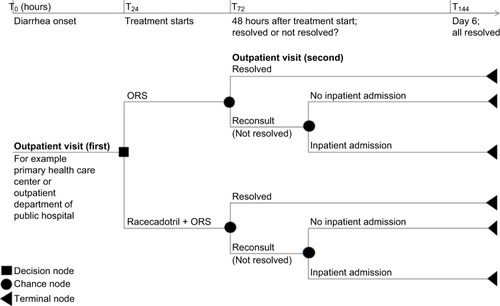
Table 1 Thailand cost data model inputs and cost calculation
Table 2 Calculation of average cost of treatment per child per adverse event (R+ORS and/or ORS alone)
Table 3 Budget impact calculation for the population cohort eligible for R+ORS and/or ORS alone
Table 4 Mean cost per patient for drugs, outpatient care, inpatient care and adverse events for R+ORS versus ORS alone
Figure 2 Incremental cost-effectiveness ratio on the cost utility plane.
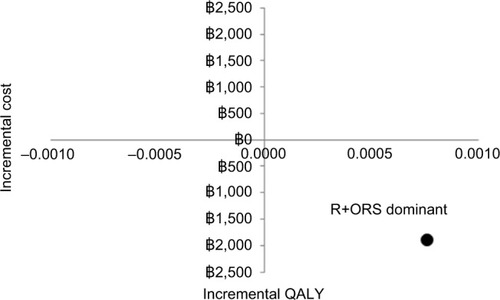
Figure 3 Tornado diagram of deterministic sensitivity analysis.
Abbreviations: AE, adverse event; LOS, length of stay; ORS, oral rehydration solution; QoL, quality of life; R, racecadotril.
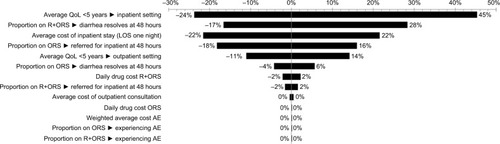
Table 5 Budget impact results year 0 (current) to year 5, assuming 5% increase in market share for R+ORS
Figure 4 Percentage overall health expenditure current year (0) to year 5 for ORS and R+ORS
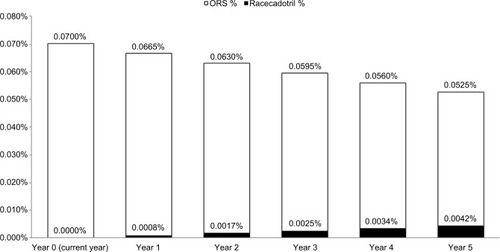
Table S1 Model adaptation Thailand: base case parameters