
Figures & data
Table 1 Parameters used to model clinical events, parameters’ value, and source of data
Table 2 Unit costs (Euros) associated with resource item and source of data
Table 3 Cost-consequence analysis SITA versus SU over 3-year time horizon (societal perspective)
Table 4 Cost-consequence analysis SITA versus SU over 3-year time horizon (INHS perspective)
Figure 1 Avoided events SITA+Met versus SU+Met.
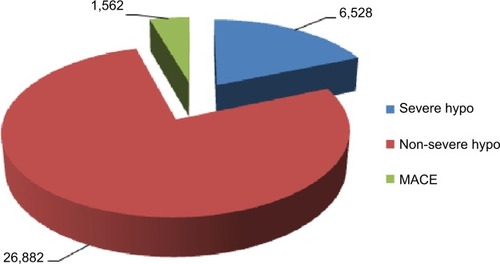
Table 5 Scenario analysis: cost-consequence analysis SITA versus SU over 3-year time horizon (societal perspective) without MACE
Table 6 Scenario analysis: cost-consequence analysis SITA versus SU over 3-year time horizon (INHS perspective) without MACE
Figure 2 One-way sensitivity analysis: tornado graph.
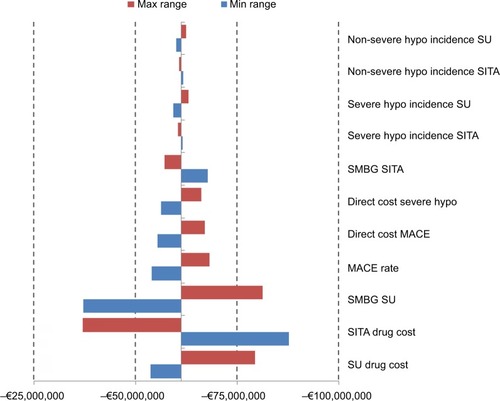
Table S1 Details of data used to obtained average costs of drug costs for SU+Met
Table S2 Details of data used to value direct costs of MACE