
Figures & data
Table 1 ACR and EULAR criteria: TCZ + Mtx versus ABT + Mtx
Table 2 Mean 6-monthly cost of treatment with bDMARDs
Table 3 Monitoring: mean 6-monthly cost
Table 4 Number needed to treat
Table 5 Mean 6-monthly cost of treatment per patient
Figure 1 Mean cost per NNT: ACR criteria.
Abbreviations: NNT, number needed to treat; ACR, American College of Rheumatology; sc, subcutaneous; iv, intravenous; ABT, abatacept; Mtx, methotrexate; TCZ, tocilizumab.
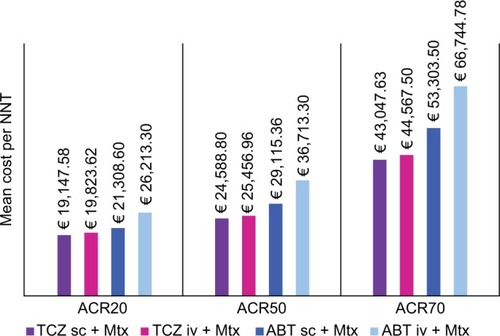
Figure 2 Mean cost per NNT: EULAR criteria.
Abbreviations: NNT, number needed to treat; EULAR, European League against Rheumatism; sc, subcutaneous; iv, intravenous; ABT, abatacept; Mtx, methotrexate; TCZ, tocilizumab.
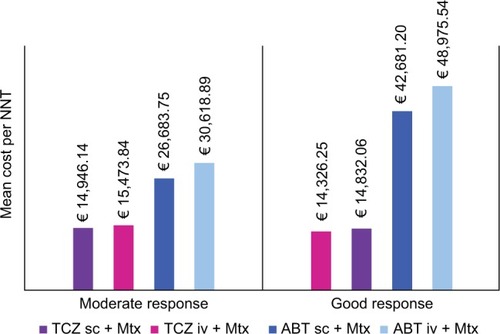
Table 6 Sensitivity analysis (efficacy data variation)
Table 7 Cost per NNT – comparison at 24 weeks of treatment