
Figures & data
Table 1 Risk reduction in stroke and bleeding eventsTable Footnote* using NOACs compared with warfarin
Figure 1 Different cost perspectives in oral anticoagulant therapy.
Abbreviation: INR, international normalized ratio.
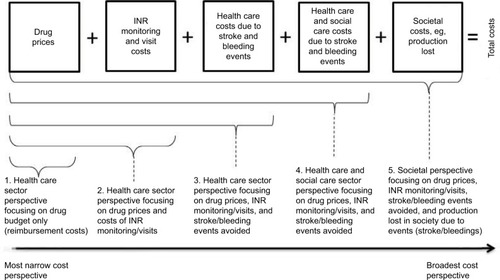
Figure 2 Annual costs per NVAF patient receiving warfarin versus dabigatran 110 mg and 150 mg (US$).**
Notes:
*Including the costs of stroke and bleedings; **annual costs for the warfarin alternative are presented in the white boxes in the figure, whereas the annual costs in the dabigatran alternative are presented in the gray shaded boxes.
Abbreviation: NVAF, nonvalvular atrial fibrillation.
Abbreviation: NVAF, nonvalvular atrial fibrillation.
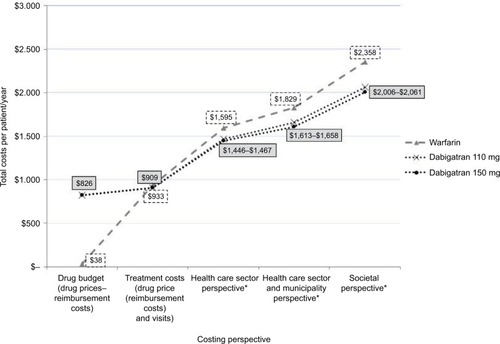
Figure 3 Annual costs per NVAF patient receiving warfarin versus rivaroxaban 20 mg (US$).**
Notes:
*Including the costs of stroke and bleedings; **Annual costs for the Warfarin alternative are presented in the white boxes in the figure, whereas the annual costs in the rivaroxaban alternative are presented in the gray shaded boxes.
Abbreviation: NVAF, nonvalvular atrial fibrillation.
Abbreviation: NVAF, nonvalvular atrial fibrillation.
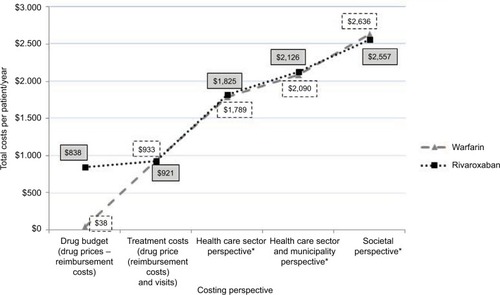
Figure 4 Annual costs per NVAF patient receiving warfarin versus apixaban 5 mg (US$).**
Notes:
*Including the costs of stroke and bleedings; **annual costs for the warfarin alternative are presented in the white boxes in the figure, whereas the annual costs in the apixaban alternative are presented in the gray shaded boxes.
Abbreviation: NVAF, nonvalvular atrial fibrillation.
Abbreviation: NVAF, nonvalvular atrial fibrillation.
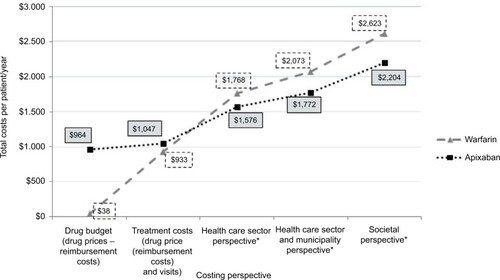
Figure 5 Annual costs per NVAF patient receiving warfarin versus edoxaban 60 mg (US$).**
Notes:
*Including the costs of stroke and bleedings; **annual costs for the warfarin alternative are presented in the white boxes in the figure, whereas the annual costs in the edoxaban alternative are presented in the gray shaded boxes.
Abbreviation: NVAF, nonvalvular atrial fibrillation.
Abbreviation: NVAF, nonvalvular atrial fibrillation.
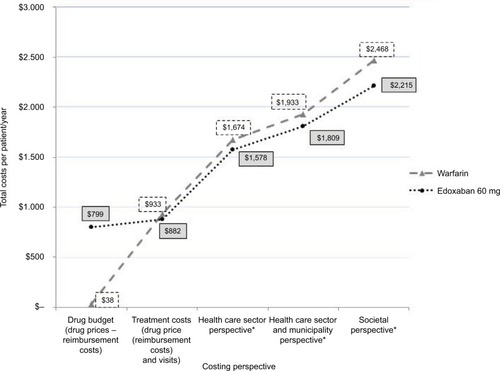
Table 2 Annual average costs of INR monitoring of warfarin patients (US$)
Table 3 Total extra costs of first-incident stroke and first-incident bleeding events in AF patients – 3-year present values (US$)