Figures & data
Figure 1 Structure of the Markov model for chronic hepatitis B.
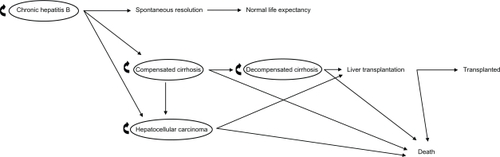
Figure 2 Total costs at 10 years for drugs and other health costs calculated for a cohort of 100 patients.
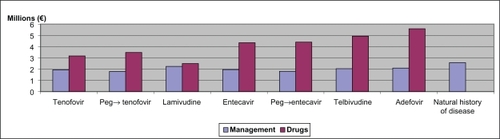
Figure 3 Mean cost per patient per year.
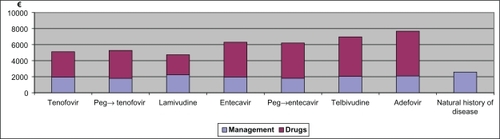
Table 1 Input data of the base case scenario
Table 2 Virologic response, HBV resistance, and seroconversion rates for each antiviral drug for both HBeAg-positive and -negative patients
Table 3 Cost data: average cost of different stages of the disease (€, year 2009 values) and annual drug costs
Table 4 Results: costs, quality-adjusted life-years (QALYs), and incremental cost-effectiveness ratio (ICER) of the base case scenario (10-year horizon)
Figure 4 Results of one-way sensitivity analyses.
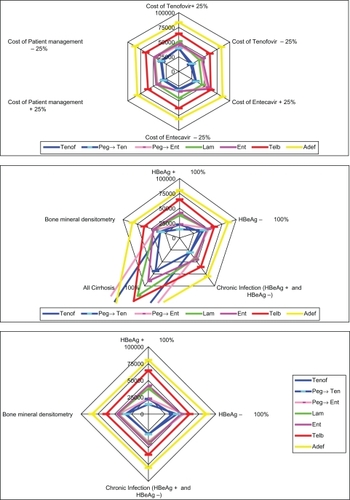
Table 5 Results of one-way sensitivity analyses