Figures & data
Figure 1 Structure of the model. The rectangles represent the possible disease states and the arrows indicate the possible transitions between those states.Citation6
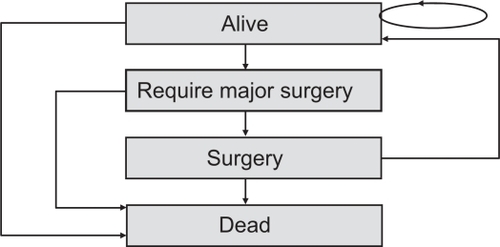
Figure 2 The four different scenarios simulated in the model.
Notes: *Regimen implemented in Scandinavian countries (Sweden) but not in Italy; **Introduced to represent a treatment strategy currently used in clinical practice in Italy.
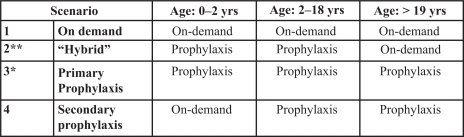
Table 1 Input data used to run the Italian model
Figure 3 Sensitivity analysis: primary prophylaxis versus treatment on demand.
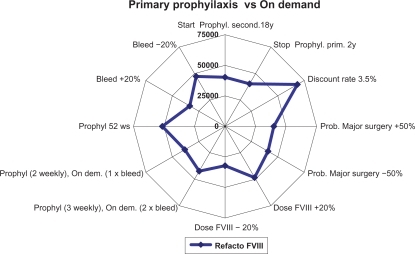
Figure 4 Sensitivity analysis: hybrid regimen versus treatment on demand.
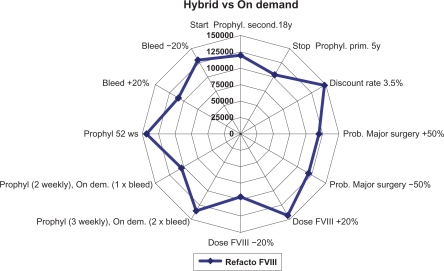
Figure 5 Sensitivity analysis: secondary prophylaxis versus treatment on demand.
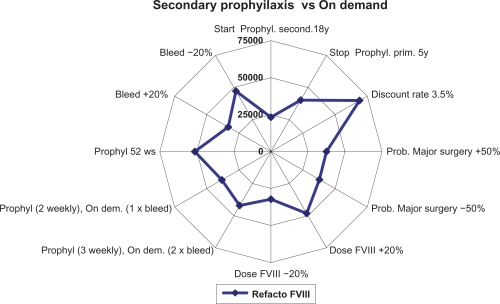
Table 2 Total costs and incremental cost-effectiveness ratios (ICERs) for phrophylaxis vs treatment on demand in individuals with severe hemophilia A