
Figures & data
Table 1 HCPCS/CPT/ICD codes or brand name for knee OA, HA, and the clinical factors considered
Figure 1 Patient distribution within the study cohort.
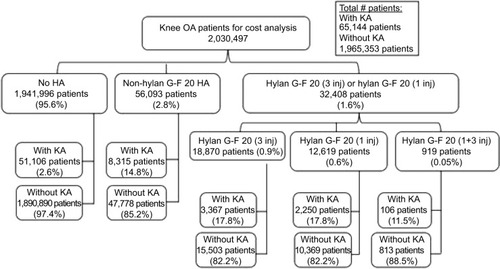
Figure 2 Overall 2-year cost of treating knee OA within the study cohort totalled $4.99B.
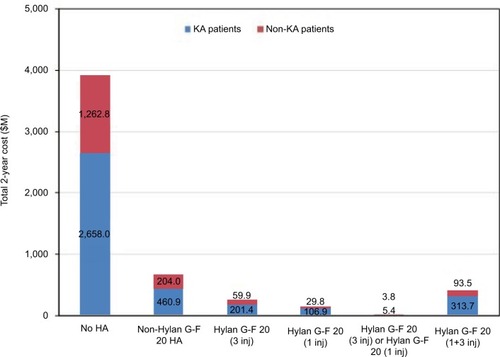
Figure 3 Average (A) and median (B and C) 2-year costs of treating knee OA for KA and non-KA patients. For the median plots, the light gray bars represent the 25th percentile (lower edge) and median (upper edge), while the dark gray bars represent the median (lower edge) and 75th percentile (upper edge).
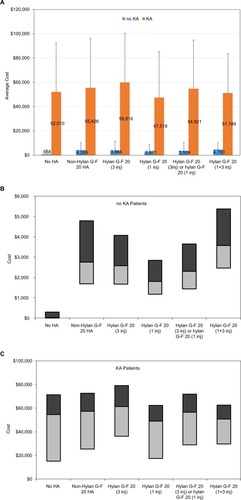
Table 2 Total cost for KA patients for each group
Figure 4 Estimated costs of $1.84B for HA patients who did not undergo KA during the study period, if they had, instead, undergone KA without delay.
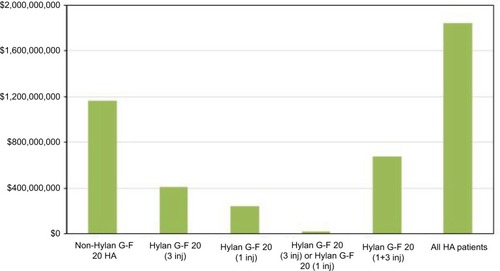
Figure 5 Estimated savings by not undergoing KA and RKA for HA patients who did not undergo KA during the 2-year study period.
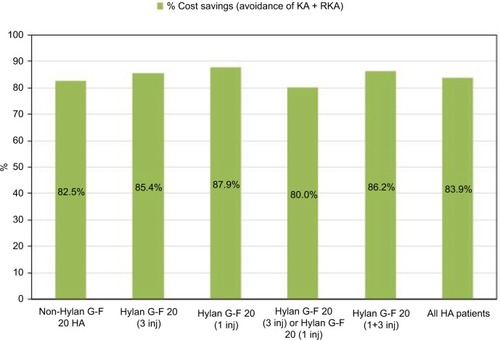
Table 3 Prevalence of use of opioids, NSAIDs, corticosteroid injections, PT, and knee arthroscopy
Table 4 Average knee OA-related costs up to and including KA and during the full 2-year period for KA patients
Table 5 Knee OA-related costs by specific clinical category up to and including KA and during the full 2-year period for KA patients