
Figures & data
Table 1 Summary of outcome variables
Table 2 Attrition table
Table 3 Descriptive statistics of the study variables for non-adherent (PDC<0.8) patients with SMI stratified by history of noncompliance status
Figure 1 Predicted treatment patterns for non-adherent new user patients (PDC <0.8) with SMI.
Abbreviations: LAI, long-acting injectable; SMI, serious mental illness; PDC, proportion of days covered.
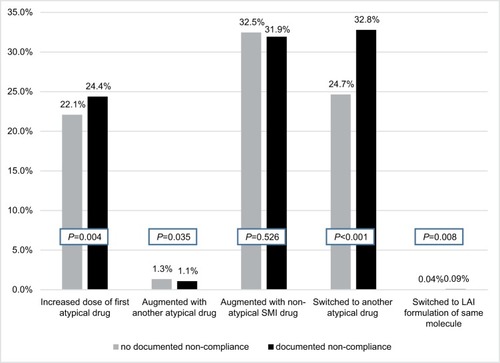
Table 4 Differences in predicted treatment patterns between patients with and without documented history of non-compliance as measured in sensitivity analyses
Table S1 Antipsychotic medications included in the analysis
Table S2 Other SMI drug classes of interest for augmenting
Table S3 Descriptive statistics of study variables for all new starter patients
Table S4 Logit regression results for all non–adherent new starter patients