
Figures & data
Table 1 Baseline cohort characteristics
Table 2 Costs of diabetes-related complications
Table 3 Summary of base case analyses
Figure 1 Cost-effectiveness acceptability curve for SAP vs CSII.
Notes: (A) Patients with suboptimal glycemic control at baseline. (B) Patients at increased risk of hypoglycemic events.
Abbreviations: CSII, continuous subcutaneous insulin infusion; QALY, quality-adjusted life year; SAP, sensor-augmented pump therapy.
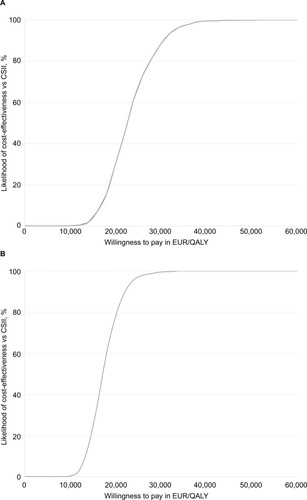
Table 4 Summary of sensitivity analyses