Figures & data
Table 1 Methods used for the assessment of each HTA dimension
Figure 1 Prisma flow chart.
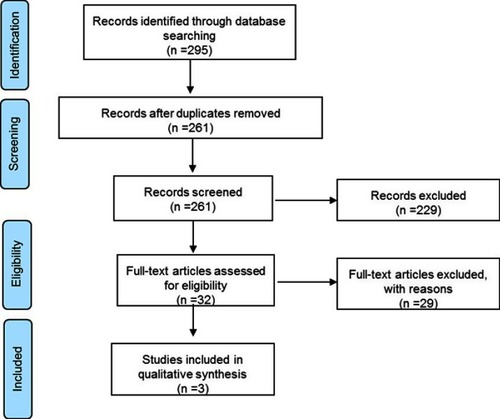
Table 2 Qualitative and quantitative assessment of scientific evidence included in the HTA report
Table 3 Rate and economic evaluation of drug-related adverse events
Table 4 Qualitative dimensions evaluation
Figure 2 Gamma distributions of AA+P and ENZA in terms of clinical pathway cost
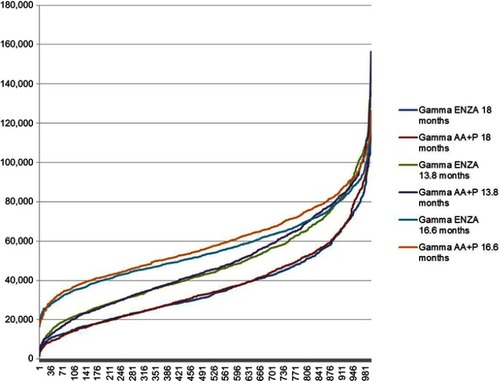
Table 5 Economic evaluation of mCRPC patient clinical pathway
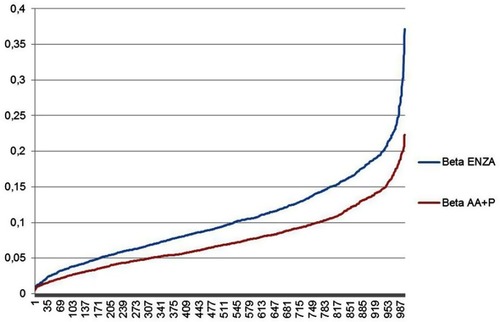
Figure 3 Beta distributions of AA+P and ENZA in terms of overall survival.
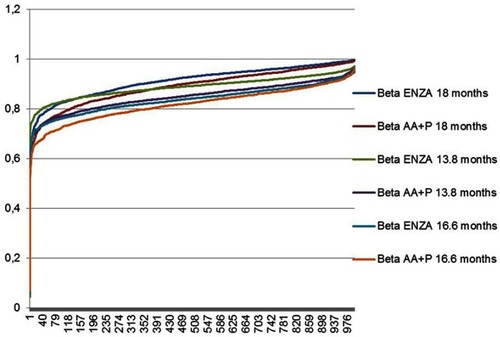
Table 6 Cost-effectiveness analysis
Figure 4 Gamma distributions of AA+P and ENZA in terms of cost-effectiveness value
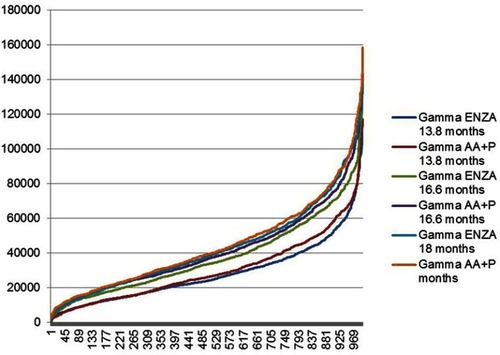
Table 7 Budget impact analysis results
Table 8 Follow-up monitoring activities
Table 9 Multi-criteria decision analysis
Figure 5 Gamma distributions of AA+P and ENZA in terms of MCDA final value