
Figures & data
Figure 1 Model schematic.
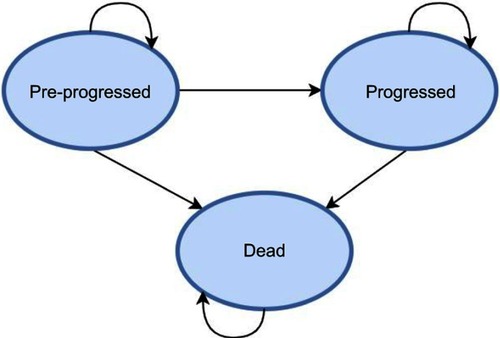
Figure 2 Progression-free survival and overall survival curves.
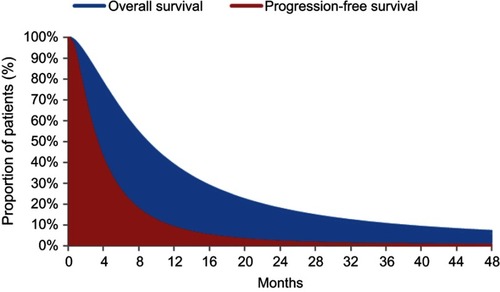
Table 1 Details of TAs and marginal cost-effectiveness ratios
Table 2 Replicated TA403 model results with corrected discount rate
Table 3 Results of Scenario 1 (separation of post-progression background costs)
Table 4 Results of Scenario 2 (adopting end-of-life criteria using arbitrary QALY weightings)
Table 5 Results of Scenario 3 (adopting end-of-life criteria using population norm QALY weightings)
Table 6 Marginal cost-effectiveness ratios by QALY weighting with applied transition costs
Table S1 Table of exclusions with reasons from the TA review
Table S2 Model inputs used for matched replication
Table S3 Model results for Replication 1, where inputs matched to the company’s submission
Table S4 Artificially deflated utilities applied to second replication
Table S5 Model results for Replication 2, where utilities were artificially deflated