
Figures & data
Table 1 Percentage of patients achieving treatment targets
Table 2 Example cost of control calculation
Table 3 Annual treatment costs
Figure 1 Number needed to treat to bring one patient to target.
Notes: Hypoglycemia was defined as treatment-emergent severe or blood-glucose confirmed symptomatic hypoglycemic events. (A) Number needed to treat to bring one patient to target for single and composite endpoints with HbA1c values <7.0%. (B) Number needed to treat to bring one patient to target for single and composite endpoints with HbA1c values ≤6.5%.
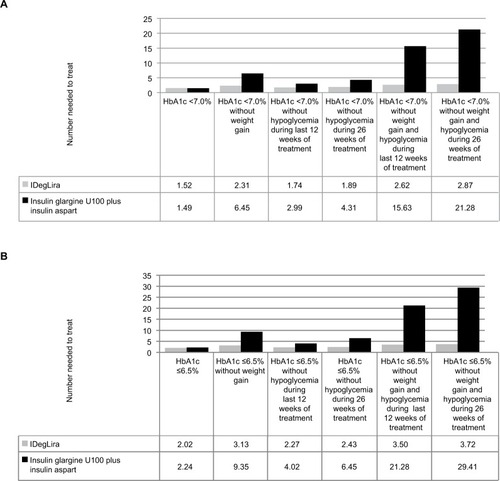
Figure 2 Cost of control.
Notes: Costs are given in 2017 US dollars ($). Hypoglycemia was defined as treatment-emergent severe or blood-glucose confirmed symptomatic hypoglycemic events. (A) Cost of control for single and composite endpoints with HbA1c values <7.0%. (B) Cost of control for single and composite endpoints with HbA1c values ≤6.5%.
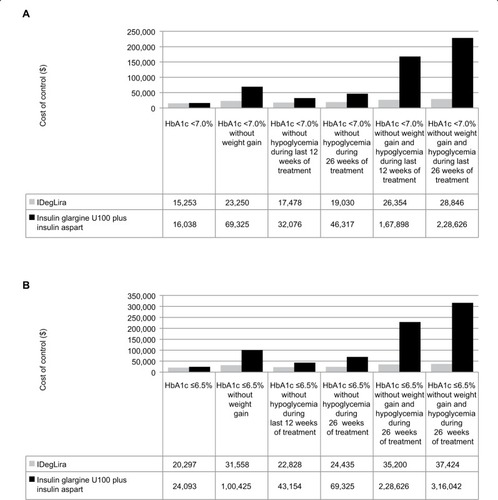
Table 4 Sensitivity analysis results: difference in cost of control for IDegLira vs insulin glargine U100 plus insulin aspart