
Figures & data
Figure 1 Determinants of per-patient health care cost through 90 days after primary THA with the AA or a matched sample of primary THA cases in the USA (Control).
Abbreviations: AA, anterior approach; THA, total hip arthroplasty.
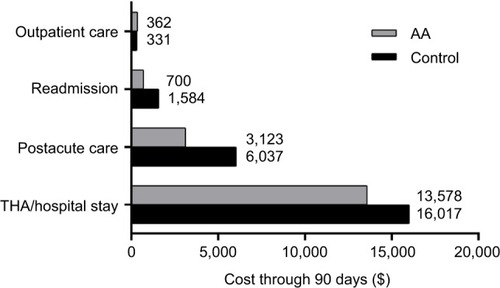
Figure 2 Cumulative cost curve comparing per-patient costs through 90 days after primary total hip arthroplasty using the AA or a matched sample of primary total hip arthroplasty cases in the USA (Control).
Note: Mean health care costs were $6,207 (95% CI: $5,210–$7,204) lower with AA.
Abbreviation: AA, anterior approach.
Abbreviation: AA, anterior approach.
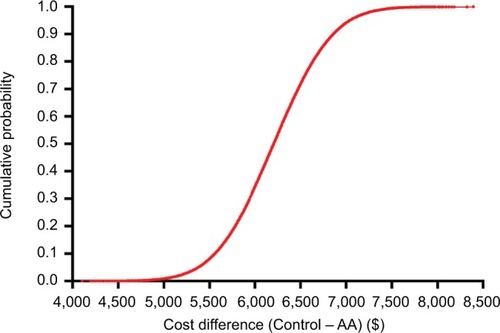
Table 1 Base-case model inputs