
Figures & data
Table 1 Baseline characteristics of selected studies
Figure 1 Comparison network.
Abbreviation: AML, acute myeloid leukemia.
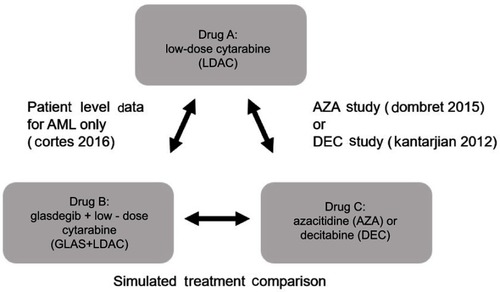
Figure 2 Multi-stepped criteria to conduct and evaluate simulated treatment comparisons.
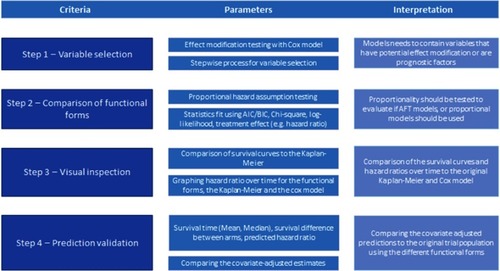
Table 2 Variable selection: GLAS + LDAC vs AZA
Figure 3 Overlay of Kaplan-Meier with exponential parametrization adjusting trial IPD (A) AZA and (B) DEC populations.
Abbreviations: AZA, azacitidine; DEC, decitabine; GLAS, glasdegib; K-M, Kaplan-Meier; LDAC, low-dose cytarabine; IPD, individual patient data; OS, overall survival.
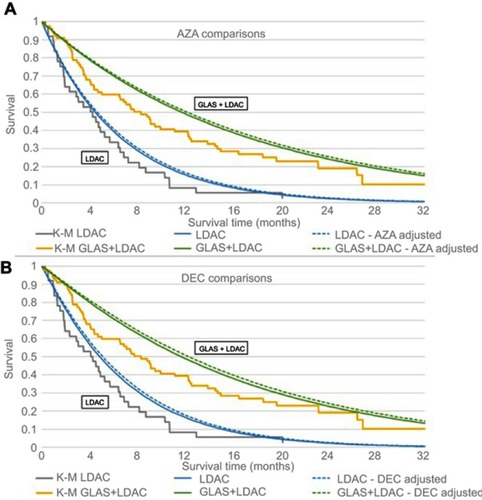
Figure 4 Overlay of Kaplan-Meier with Weibull parametrization for the weighted STC approach (A) AZA and (B) DEC populations.
Abbreviations: AZA, azacitidine; DEC, decitabine; GLAS, glasdegib; K-M, Kaplan-Meier; LDAC, low-dose cytarabine; IPD, individual patient data; OS, overall survival; STC, simulated treatment comparison.
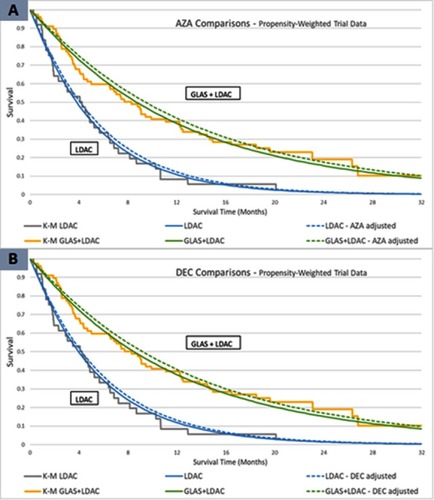
Table 3 ITC Cox and STC exponential model results: AZA comparison, DSU guidance
Table 4 ITC Cox and STC exponential model results: AZA comparison, weighted STC approach
Figure 5 Forest plots of exponential and Cox model estimates for (A) GLAS + LDAC versus AZA and (B) GLAS + LDAC versus DEC, DSU guidance.
Abbreviations: AZA, azacitidine; DEC, decitabine; GLAS, glasdegib; ITC, indirect treatment comparison; LDAC, low-dose cytarabine; STC, simulated treatment comparison.
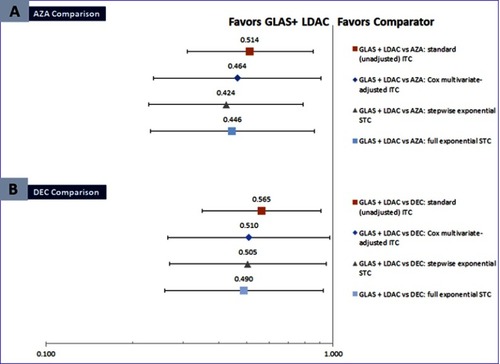
Figure 6 Forest plots of exponential and Cox model estimates for (A) GLAS + LDAC versus AZA and (B) GLAS + LDAC versus DEC, weighted STC approach.
Abbreviations: AZA, azacitidine; DEC, decitabine; GLAS, glasdegib; HR, hazard ratio; ITC, indirect treatment comparison; LDAC, low-dose cytarabine; STC, simulated treatment comparison.
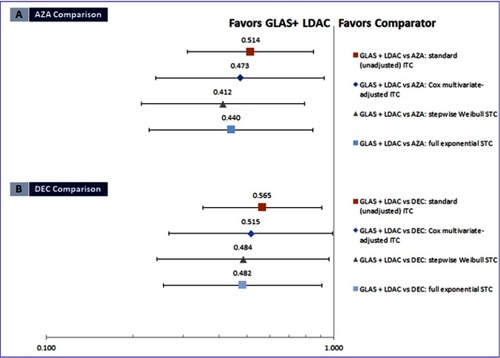
Table 5 Inclusion of covariates, GLAS + LDAC vs DEC
Table 6 ITC Cox and STC exponential model results: DEC comparison, DSU guidance
Table 7 ITC Cox and STC exponential model results: DEC comparison, weighted STC approach