Figures & data
Figure 1 Markov model structure. Depiction of model structure used for analysis.
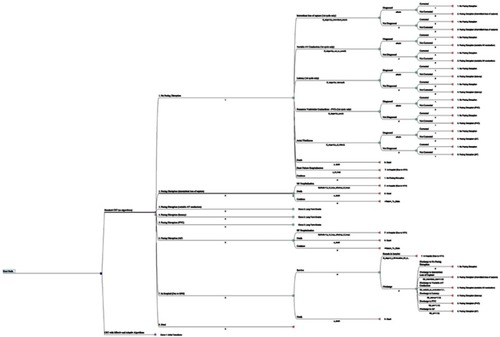
Table 1 Base case model parameters
Table 2 Clinical projections and economic results
Figure 2 Tornado diagram (one-way sensitivity analysis; US$). Numbers in brackets represent the lower and upper bounds of the value used for each parameter.
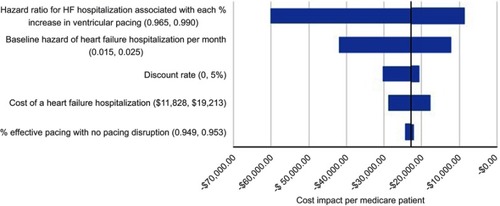
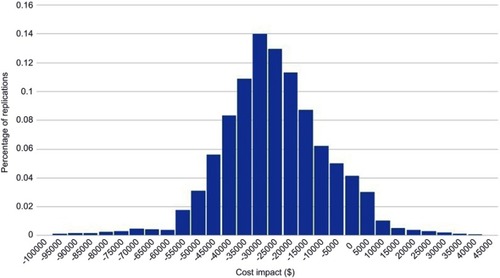
Figure 3 Probabilistic analysis results (US$).