
Figures & data
Figure 1 Graphical representation of the model structure.
Abbreviation: NYHA, New York Heart Association.
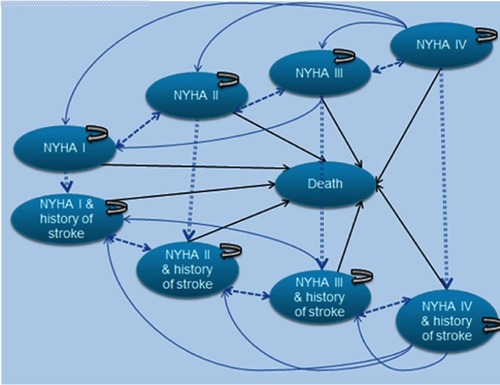
Table 1 Clinical outcomes for intermediate-risk patients
Table 2 Clinical outcomes for high-risk patients
Table 3 Procedural cost by patient risk population*
Table 4 Costs and dis-utilities applied to model events
Table 5 Base-case cost-effectiveness results
Figure 2 Cost-effectiveness acceptability curves for TAVI (SAPIEN 3) versus SAVR.
Abbreviations: TAVI, transcatheter aortic valve implantation; SAVR, surgical aortic valve replacement; QALY, quality-adjusted life year.
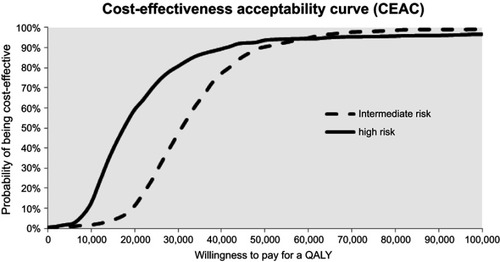
Table 6 One-way sensitivity analysis: TAVI using SAPIEN 3 versus SAVR