
Figures & data
Figure 1 Method of determining the equivalence of CAPD and APD groups. To compare the cost-effectiveness of CAPD and APD, data were processed by conducting an analysis of the propensity score and a stratified analysis to ensure equivalence between the two groups.
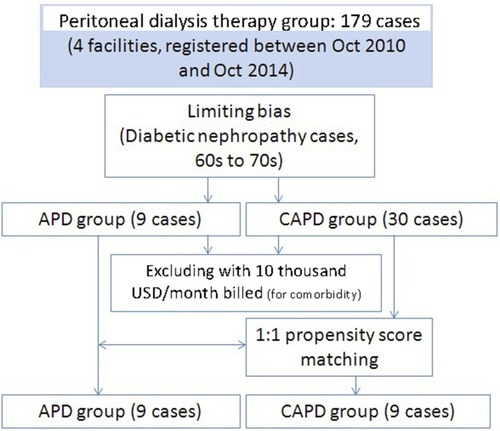
Table 1 Patients’ clinical characteristics
Figure 2 Changes over the course of PD intervention and cost-effectiveness. The cost-effectiveness tended to gradually deteriorate once PD intervention was initiated (difference became marked from 36 months). Furthermore, the baseline CUA for 12–24 months was significantly better in the PD group than in the HD group. Error bars denote standard error (SE). Statistical significance of population mean difference was analyzed using Welch’s t-test.
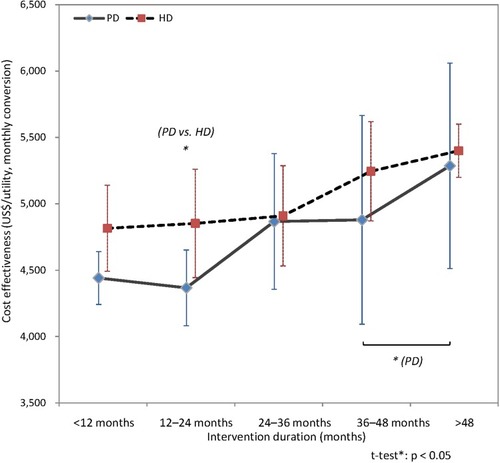
Table 2 Comparison of the PD and HD cost-effectiveness (Baseline cost-utility analysis)
Table 3 Correlation analysis of factors influencing the cost-effectiveness
Figure 3 A cost-utility analysis by primary disease. Adjusting the baseline CUA by disease revealed that glomerulonephritis had a significantly better CUA than nephropathy. Error bars denote SE. Statistical significance of population mean difference was analyzed using Welch’s t-test.
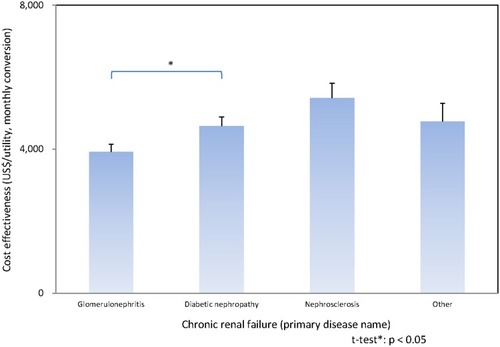
Figure 4 A medical cost analysis by age. The medical costs for patients in their 50s were significantly higher than those in their 60s and 70s. In general, medical costs for the elderly tended to be lower than those for middle-aged patients (indices in the figure: 5th percentile, first quartile; median, 3rd and 95th percentile; outliers of maximum and minimum). Statistical significance of population mean difference was analyzed using Welch’s t-test.
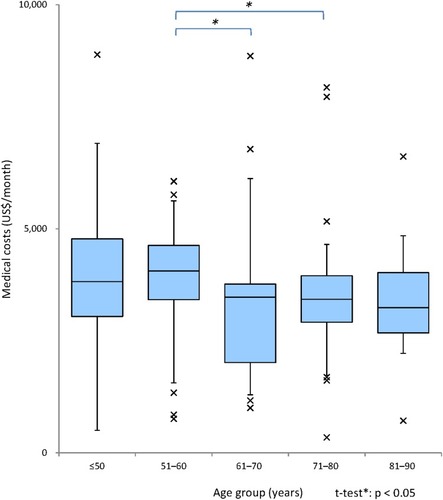
Figure 5 A cost-utility analysis by age. The baseline CUA was adjusted by age group and showed a tendency for a significantly higher CUA for patients in their 70s than for those in their 50s. Error bars denote SE. Statistical significance of population mean difference was analyzed using Welch’s t-test.
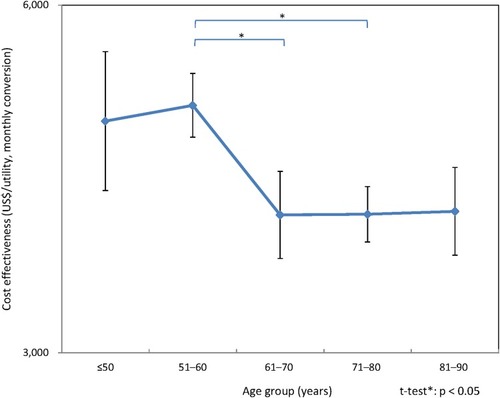
Table 4 Comparison of the CAPD and APD cost-effectiveness and incremental cost-utility ratio