Figures & data
Figure 1 Decision tree and Markov model for patients with Barrett’s esophagus: (A) Decision tree: patient options at decision node include standard of care (SOC) surveillance and treatment and Assay-guided surveillance and treatment. Parameters used in decision tree are detailed in . A summary of the Assay guided surveillance and treatment protocol for BE is provided in . (B) Markov model: Patients can be in one of the 8 health states. Patients start from the health state of BE (NDBE, IND and LGD) and the arrows indicate the possible transitions from one state to another.
Abbreviations: LGD, low-grade dysplasia; IND, indefinite for dysplasia; NDBE, nondysplastic Barrett’s esophagus.
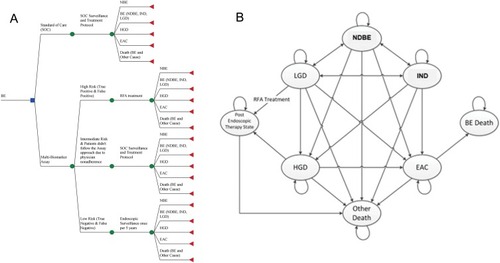
Table 1 Model Inputs
Table 2 Summary Of Assay Guided Surveillance And Treatment Protocol For BE
Table 3 Base-Case Analysis Of Assay vs SOC 1–5 Years: Total Costs, QALYs And ICER
Figure 2 One-way sensitivity analysis: selected parameters with the largest impact on the ICER. (A–C) NDBE, IND and LGD annual progression rates to EAC in SOC, respectively; (D) assay cost; (E) cost of endoscopy with biopsy; (F) physician adherence rate to the Assay strategy (5-year surveillance interval for low risk, SOC surveillance for intermediate risk, endoscopic treatment for high risk).
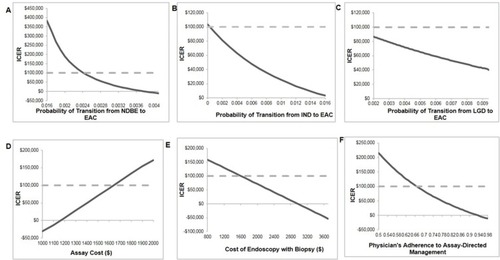
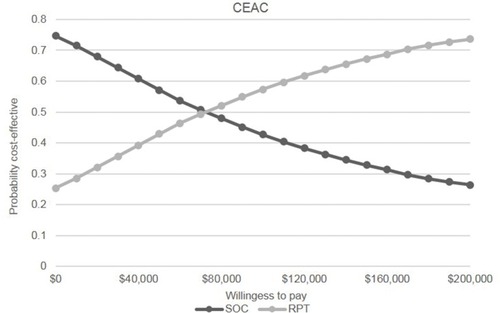
Figure 3 Probabilistic sensitivity analysis.