Figures & data
Figure 1 Model flow. Transition probabilities: P0, probability of remaining in current state; P1, probability of transitioning to next, more severe state; PD, probability of death.
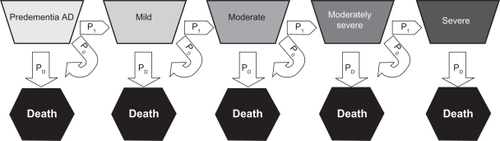
Table 1 Definition of disease states for Alzheimer’s disease
Figure 2 Intradisease state outcome details. Transition probabilities: P0, probability of remaining in current state; P1, probability of transitioning to next, more severe state; PD, probability of death.
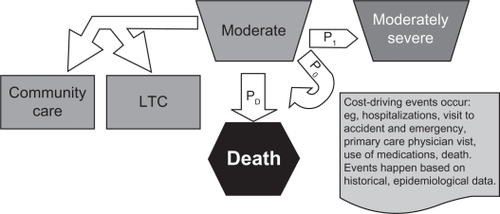
Figure 3 Left panel: Markov model results showing the estimated count of patients (y axis) and time spent (x axis) with predementia or mild AD when initiating DMT during predementia AD (light gray line), DMT during mild–moderate AD (medium gray line), or SOC during mild–moderate AD (black line). Right panel: the cumulative time spent in predementia or mild AD if initiating DMT during predementia AD (light gray line), DMT during mild–moderate AD (medium gray line), or SOC during predementia AD (black line).
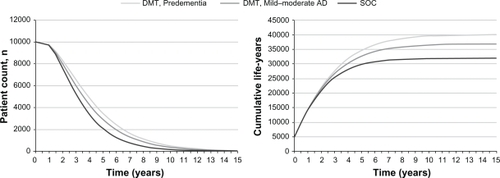
Figure 4 Left panel: Markov model results showing the estimated count of patients (y axis) and time spent (x axis) with moderate–severe AD when initiating DMT during predementia AD (light gray line), DMT during mild–moderate AD (medium gray line), or SOC during mild–moderate AD (black line). Right panel: the cumulative time spent in moderate or severe AD if initiating DMT during predementia AD (light gray line), DMT during mild–moderate AD (medium gray line), or SOC during predementia AD (black line).
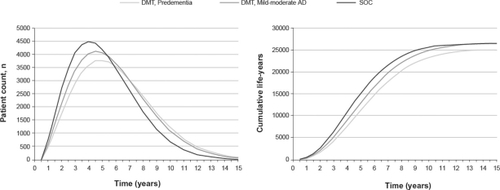
Figure 5 Estimated patient count (y axis) and time of death (x axis) for patients initiating DMT during predementia AD (light gray line), DMT during mild–moderate AD (medium gray line), or SOC during mild–moderate AD (black line).

Table 2 Average life-years in disease states for different DMT efficacies (all data in years)
Figure 6 Estimated patient count (y axis) and time spent (x axis) in the community if initiating DMT during predementia AD (light gray line), DMT during mild–moderate AD (medium gray line), or SOC during mild–moderate AD (black line). Right panel: the cumulative time spent in the community if initiating DMT during predementia AD (light gray line), DMT during mild–moderate AD (medium gray line), or SOC during mild–moderate AD (black line).
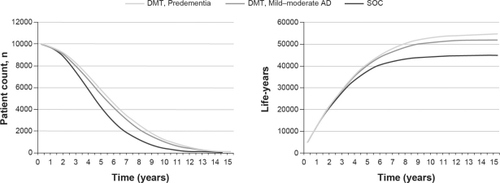
Figure 7 Estimated count of patients (y axis) and time spent (x axis) in long-term care if initiating DMT during predementia AD (light gray line), mild–moderate AD (medium gray line), or SOC during predementia AD (black line). Right panel: the cumulative time spent in long-term care if initiating DMT during predementia (light gray line), DMT during mild–moderate AD (medium gray line), or SOC during mild–moderate AD (black line).
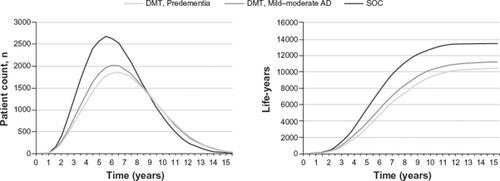
Table 3 Life-years in the community (home) versus in long-term care for different DMT efficacies (all data in years)