Figures & data
Figure 1 Analytical decision model.
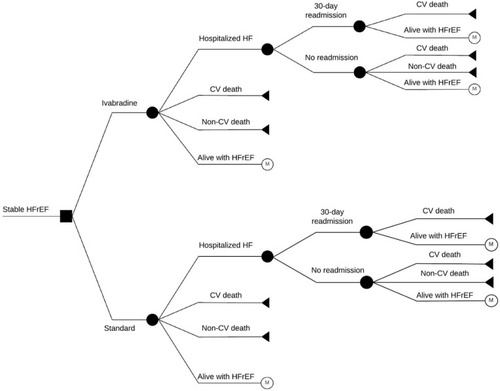
Table 1 Clinical Input Parameters
Table 2 Costs and Utility Parameters
Table 3 Base-Case Results
Figure 2 Tornado diagram of ivabradine plus standard treatment compared with standard treatment alone. (A) Cohort population. (B) Subgroup population with baseline HR ≥77 bpm.
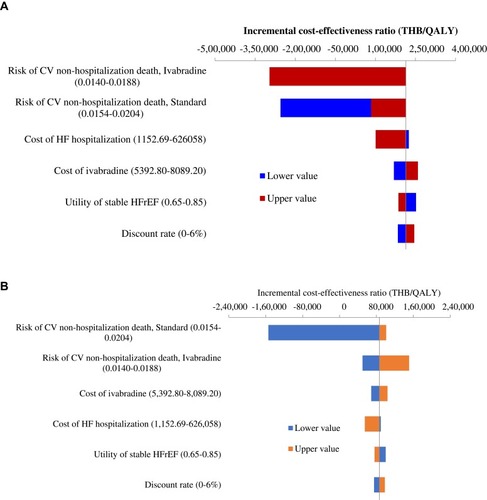
Figure 3 Analysis of the incremental cost-effectiveness ratio relative to changes in the daily cost of ivabradine.
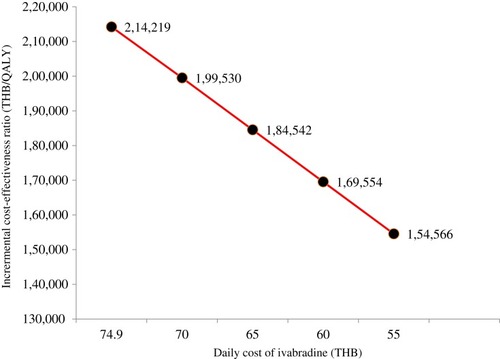
Figure 4 Scatter plots of 1000 iterations for ivabradine plus standard treatment compared with standard treatment alone on a cost-effectiveness plane. (A) Cohort population. (B) Subgroup population with baseline HR ≥77 bpm.
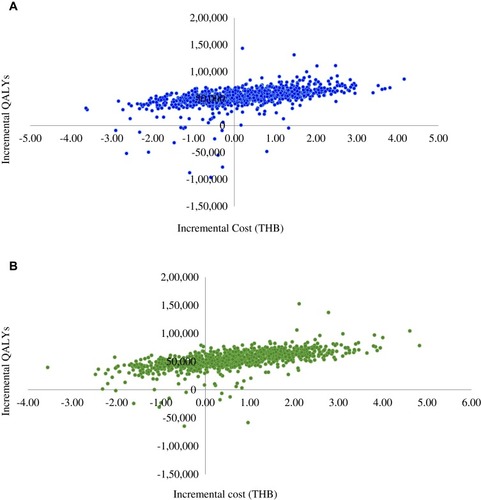
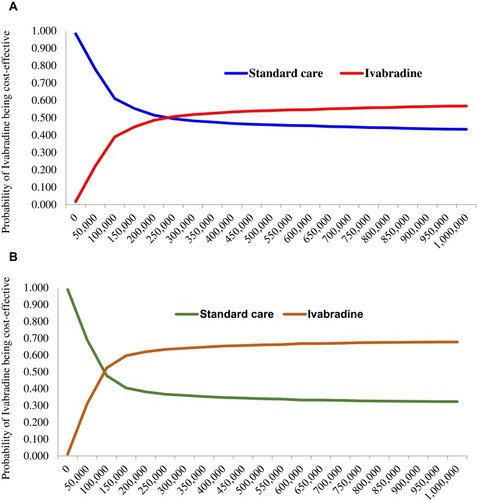
Figure 5 Cost-effectiveness acceptability curve of ivabradine plus standard treatment compared with standard treatment alone. (A) Cohort population. (B) Subgroup population with baseline HR ≥77 bpm.