
Figures & data
Figure 1 Cost-effectiveness model structure.
Notes: [+] Clone refers to a copy of the decision-tree branches directly above. Grey portions of the tree denote components that are used only during scenario analyses. *Included in the cost of each treatment is the expected cost of a thromboembolic event.
![Figure 1 Cost-effectiveness model structure.Notes: [+] Clone refers to a copy of the decision-tree branches directly above. Grey portions of the tree denote components that are used only during scenario analyses. *Included in the cost of each treatment is the expected cost of a thromboembolic event.](/cms/asset/caa11019-6b32-4442-9c0b-cfa429fc61ed/dceo_a_12162283_f0001_b.jpg)
Table 1 Population and Subpopulations for Base-Case Analysis
Table 2 Model Inputs: Treatment Costs per Procedure for Avatrombopag and Lusutrombopag (2019 USD)
Table 3 Base-Case Results: Overall Population (Platelet Count <50×109/L)
Figure 2 One-way sensitivity analyses results. (A) Cost per prophylactic platelet transfusion avoided with avatrombopag in comparison with prophylactic platelet transfusion in the overall patient population. (B) One-way sensitivity analysis results: cost per prophylactic platelet transfusion avoided with avatrombopag in comparison with lusutrombopag in the overall population.
Note: Gray indicates the lower bound and black indicates the upper bound.
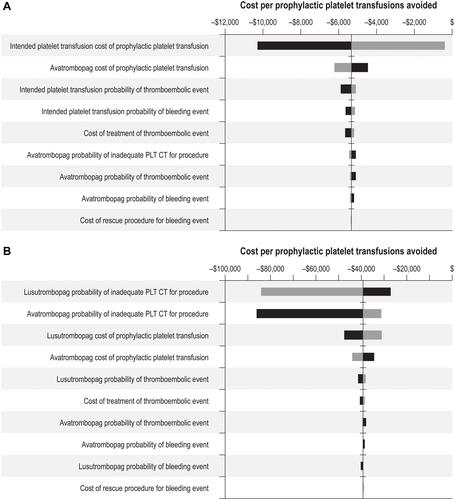
Figure 3 Probabilistic sensitivity analyses results. (A) Probabilistic sensitivity analysis results: cost per prophylactic platelet transfusion avoided with avatrombopag in comparison with prophylactic platelet transfusion in the overall population. (B) Probabilistic sensitivity analysis results: cost per prophylactic platelet transfusion avoided with avatrombopag in comparison with lusutrombopag in the overall population.
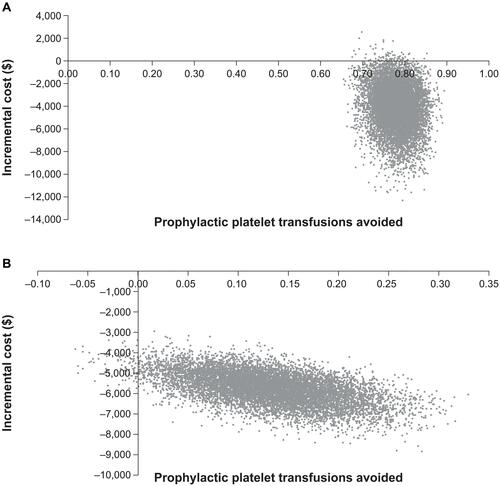
Table 4 Base-Case Results for Scenario Analysis Incorporating Long-Term Outcomes: Overall Population (Platelet Count <50×109/L)