
Figures & data
Figure 1 Prisma Flow Chart.
Note: Adapted from Moher D, Liberati A, Tetzlaff J, Altman DG. The PRISMA Group. Preferred reporting items for systematic reviews and meta-analyses: the PRISMA statement. PLoS Med. 2009;6(7):e1000097.Citation28
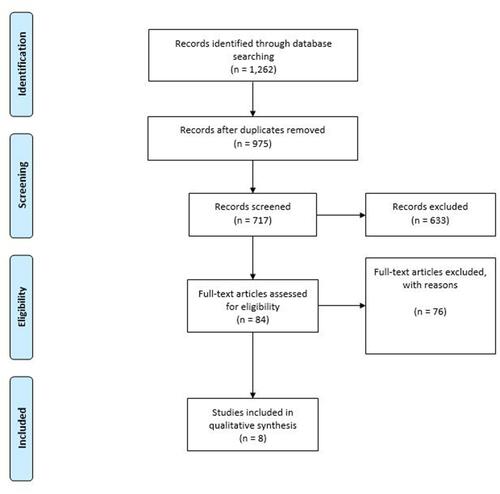
Table 1 Safety and Efficacy Indicators, Derived from Literature Evidence
Figure 2 Beta distributions for the efficacy indicator.
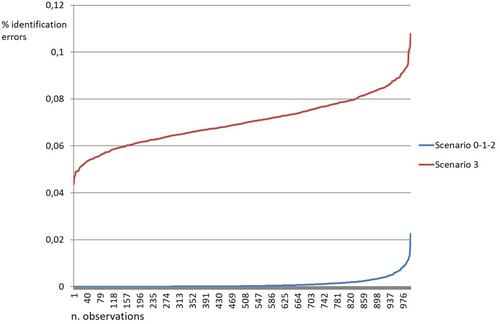
Table 2 Economic Evaluation and Cost-Efficacy Analysis
Figure 3 Gamma distributions for the process cost.
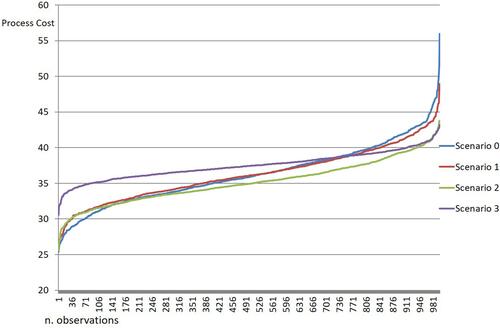
Figure 4 Gamma distributions for the process cost, without considering the costs related to human resources.
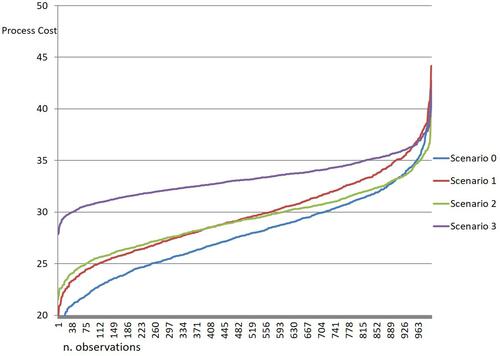
Table 3 Budget Impact Analysis
Table 4 Time Required for the Preparation and the Administration Phases
Figure 5 Gamma distributions for the time spent for the preparation and administration phase.
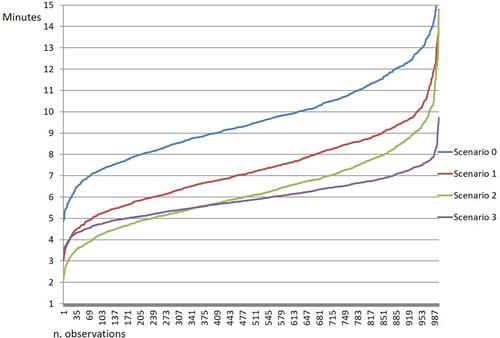
Table 5 The Definition of System Capacity