
Figures & data
Table 1 Baseline Demographic and Clinical Characteristics for Unmatched Cohorts
Figure 1 Study flow.
Abbreviations: CCH, collagenase clostridium histolyticum; DC, Dupuytren contracture.
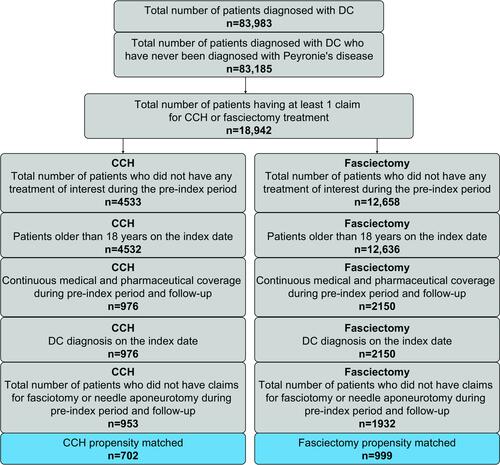
Table 2 Mean (SD) All-Cause Healthcare Costs During the 12-Month Post-Index Period in Unmatched Cohorts
Table 3 Healthcare Resource Utilization During the 12-Month Post-Index Period in the Matched Cohorts
Figure 2 Mean (SD) all-cause (A) and DC-related (B) healthcare costs during the post-index period in the matched cohorts.
Abbreviations: CCH, collagenase clostridium histolyticum; DC, Dupuytren contracture.
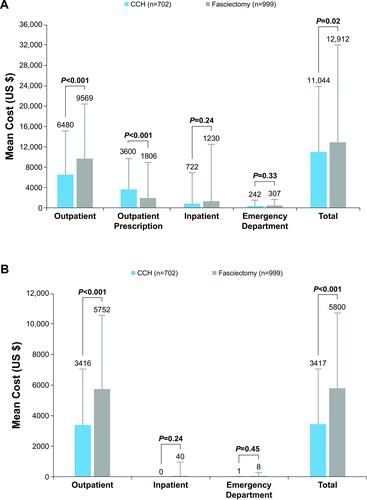
Table 4 Key Drivers of Total All-Cause Healthcare Costs in Matched Cohorts