
Figures & data
Figure 1 PRISMA flow diagrams for the HRQoL and economic SLRs (A and B).
Notes: *A further five economic studies were identified through additional targeted searches to expand the population to include those with bladder cancer, resulting in a total of 42 economic studies selected for data extraction.
Abbreviations: HRQoL, health-related quality of life; PRISMA, Preferred Reporting Items for Systematic Reviews and Meta-Analyses; SLR, systematic literature review.
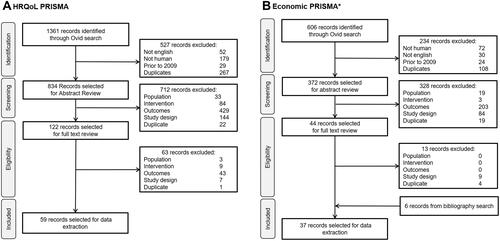
Table 1 Symptoms of NMIBC Prior to Treatment
Figure 2 HRQoL studies by NMIBC treatment and study type.
Abbreviations: BCG, Bacillus Calmette-Guerin; HRQoL, health-related quality of life; NMIBC, non-muscle invasive bladder cancer; RCT, randomized controlled trial; SLR, systematic literature review.
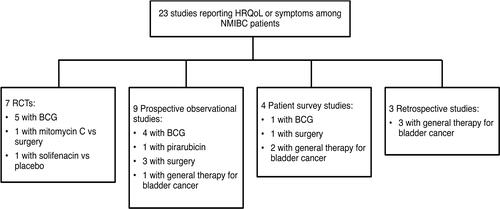
Table 2 EORTC QLQ-NMIBC24 Scores Prior to Treatment
Table 3 EORTC QLQ-C30 Scores Prior to Treatment
Figure 3 Decline in NMIBC HRQoL 2 years post-diagnosis on the SF-36* versus the general population**.
Notes: *Weighted-average scores were calculated across studies; due to the small number of studies reporting SF-36 data at the same time points, other selection criteria, such as similar study design, were not applied. **Non-cancer controls were propensity-score matched to patients. Data from these studies.Citation43,Citation44 Changes in SF-36 PCS and MCS scores of ≥5 points are considered clinically meaningful. Brisbane et al, excluded patients with prior cystectomy, whereas Smith et al, did not. When comparing SF-36 scores between the two studies, including patients with cystectomy in the NMIBC population did not appear to further reduce HRQoL as a greater decline was rather seen in the Brisbane et al, study (data not shown). Although, Smith et al, reported significant declines in physical and mental HRQoL with cystectomy in bladder cancer patients, results were not stratified by NMIBC vs muscle-invasive disease and authors noted that NMIBC patients were more likely to have received treatment not involving cystectomy. Accordingly, including patients with cystectomy in the NMIBC patient population from the Smith et al, study was not considered to considerably influence weighted-average SF-36 results.
Abbreviations: HRQoL, health-related quality of life; MCS, Mental Component Score; NMIBC, non-muscle invasive bladder cancer; PCS, Physical Component Score; SF-36, Short Form 36.
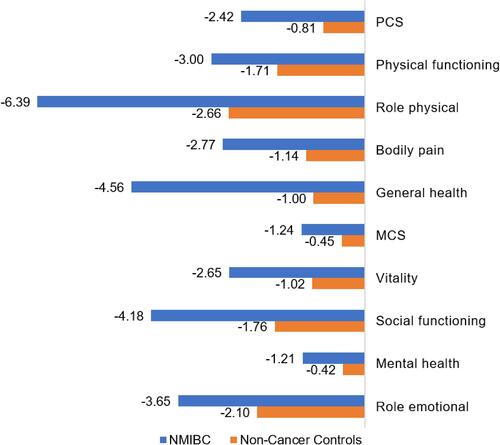
Figure 4 EORTC QLQ-C30 during BCG treatment.*#.
Notes: *Changes in EORTC QLQ-C30 domain scores of ≥10 points are considered clinically meaningful. #The weighted-average of EORTC QLQ-C30 scores was calculated across all studies that reported these data at each of the three time points; due to the small number of studies reporting these data, other selection criteria such as similar study design similarity were not applied. Data from these studies.Citation9,Citation25,Citation27,Citation35 Scores range from 0 to 100 with higher scores indicating higher (ie, worse) symptomology for symptom domains and a higher (ie, better) level of function for functional domains.
Abbreviations: BCG, Bacillus Calmette-Guerin; EORTC QLQ-C30, European Organization for the Research and Treatment of Cancer Quality of Life Questionnaire non-muscle invasive bladder cancer 24; GHS, global health status; T0, baseline; T1, end of induction; T2, maintenance.
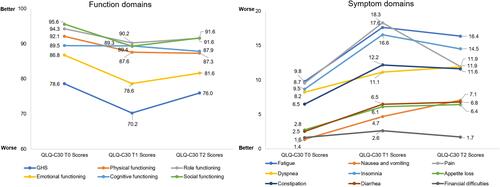
Figure 5 EORTC QLQ-NMIBC24 during BCG treatment.*.
Notes: *The weighted-average of EORTC QLQ-NMIBC24 scores was calculated across all studies that reported these data at each of the three time points; due to the small number of studies reporting these data, other selection criteria such as similar study design similarity were not applied. Data from these studies.Citation9,Citation25,Citation33 Scores range from 0 to 100 with higher scores indicating higher (ie, worse) symptomology for all, except sexual functioning where a higher score indicates better function.
Abbreviations: BCG, Bacillus Calmette-Guerin; EORTC QLQ-NMIBC24 European Organization for the Research and Treatment of Cancer Quality of Life Questionnaire superficial bladder cancer 24; T0, baseline; T1, end of induction; T2, maintenance.
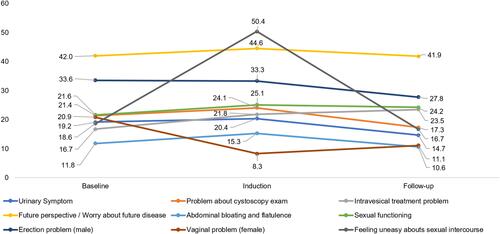
Table 4 AE Frequencies During BCG Treatment
Table 5 Per Patient Costs with High- and Low-Intensity Treatment Regimens in NMIBC