Figures & data
Figure 1 Crude incidence proportion of bleeding events during index admission*.
Notes: *The proportion of bleeding events first documented during the surgical episode was: 96.5% low anterior resection, 93.9% hysterectomy, 81.5% lung surgery, 97.9% mastectomy, and 100.0% prostate surgery; the proportion of patients with bleeding events who also had reoperation for surgical arrest of bleeding was: 0.0% low anterior resection, 21.9% hysterectomy, 44.4% lung surgery, 5.1% mastectomy, 3.5% prostate; only 1.8% of patients had reoperation for surgical arrest of bleeding without an accompanying diagnosis of haemorrhage and haematoma complicating a procedure (4 patients in the hysterectomy group, 4 patients in the lung surgery group); error bars represent 95% confidence intervals.
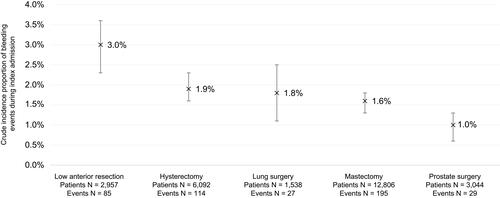
Table 1 Patient Characteristics*
Table 2 Characteristics of Index Admission and Surgery*
Figure 2 Adjusted association of bleeding events with post-procedural hospital length of stay*.
Note: *All difference in adjusted post-procedural hospital length of stay were statistically significant at P<0.05.
Abbreviations: CI, confidence interval; MID, mean incremental difference.
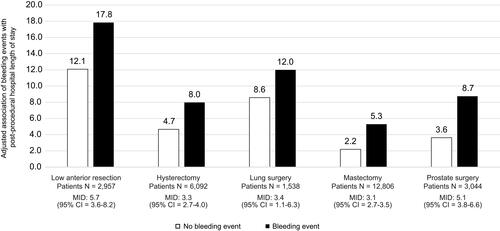
Figure 3 Adjusted association of bleeding events with post-procedural days spent in critical care*.
Note: *All difference in adjusted post-procedural days spent in critical care were statistically significant at P<0.05.
Abbreviations: CI, confidence interval; MID, mean incremental difference.
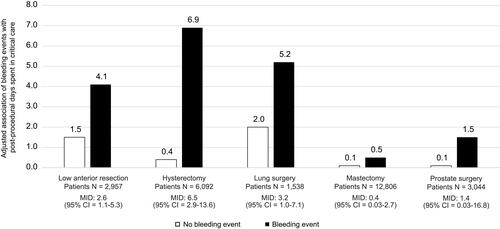
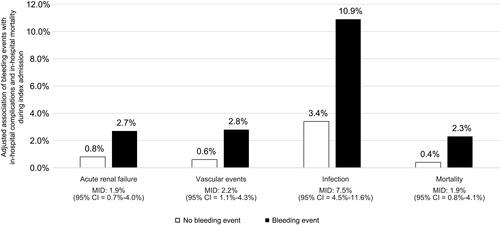
Figure 4 Adjusted association of bleeding events with in-hospital sequelae and in-hospital mortality during index admission*.
Notes: *Sequelae and mortality events were infrequent, which necessitated that we pool all patients from across the surgery groups when analyzing these outcomes; all difference in the incidence of sequelae and mortality were statistically significant at P<0.05.
Abbreviations: CI, confidence interval; MID, mean incremental difference.