Figures & data
Figure 1 Examples of pediatric patients with idiopathic scoliosis before and 2-years after surgical intervention with (A) spinal fusion or (B) VBT. (A) 15-year-old patient with 55° right thoracic curve treated with spinal fusion at 2 years postoperative follow-up. (B) 15-year-old patient with 55° right thoracic curve treated with anterior vertebral body tethering at 2 years postoperative follow-up.
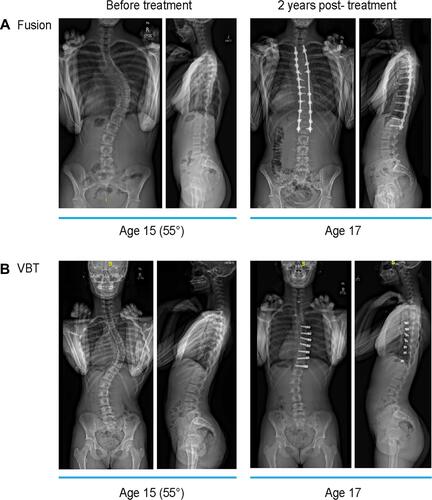
Figure 2 Structure diagram. (A) VBT treatment group (B) fusion treatment group. The fusion treatment arm structure is same across both groups (dark grey boxes).
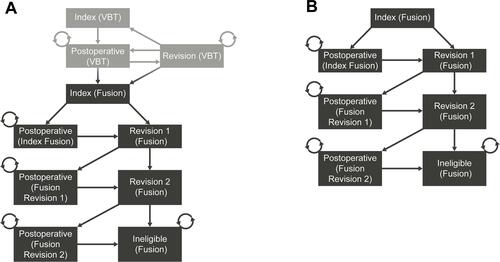
Table 1 Model Parameter Estimates
Table 2 Cost-Effectiveness in the Base Case Analysis
Figure 3 PSA Scatterplot of 1000 simulations on an incremental cost-effectiveness plane. Dashed line indicates WTP threshold used in this analysis, corresponding to the lower end of the range recommended by the WHO-CHOICE guidelines.Citation49,Citation50
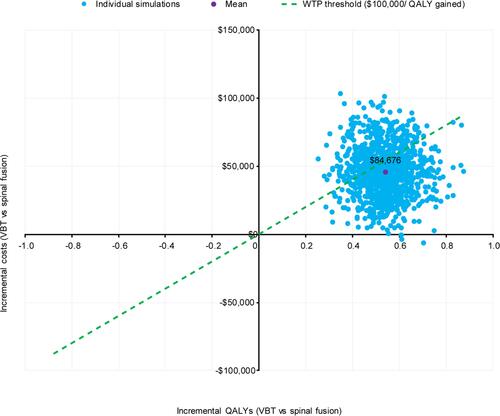
Figure 4 Cost-effectiveness acceptability curve. Dashed line indicates WTP threshold used in this analysis, corresponding to the lower end of the range recommended by the WHO-CHOICE guidelines.Citation49,Citation50
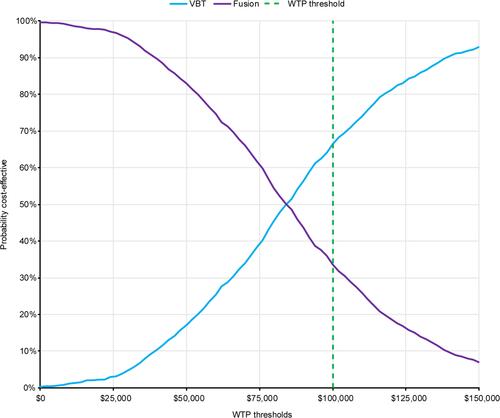
Figure 5 One-way sensitivity analysis. Sensitivity of NMB (based on a WTP threshold of $100,000/QALY) to changes in top 10 model parameters; lowering the parameter indicated in blue, increasing the parameter indicated in purple. Postoperative (Index Fusion) to Revision 1 (Fusion) is the probability of revision without prior spinal fusion in the last three months; Index (Fusion) to Revision 1 (Fusion) is the probability of revision with prior spinal fusion in the last three months. Please note that the VBT revision probabilities were not varied in the DSA, as they could not be varied in isolation of other independent parameters; these probabilities were instead varied manually, and the results are reported in the sensitivity analyses section.
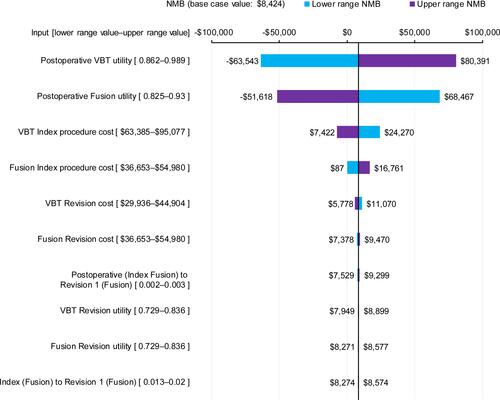
Figure 6 Scenario analysis ICERS. Dashed line indicates WTP threshold used in this analysis, corresponding to the lower end of the range recommended by the WHO-CHOICE guidelines.Citation49,Citation50
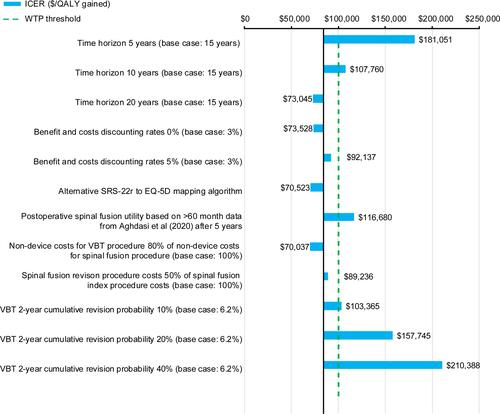
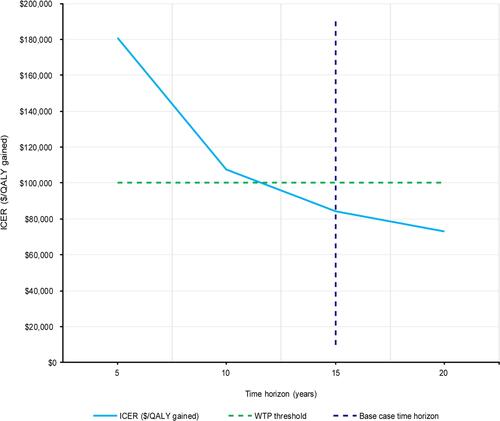
Figure 7 ICER versus time horizon. Vertical dashed line indicates the 15-year time horizon used in the base case; horizontal dashed line indicates WTP threshold used in this analysis, corresponding to the lower end of the range recommended by the WHO-CHOICE guidelinesCitation49,Citation50