
Figures & data
Figure 1 Structure of the partitioned survival model.
Abbreviations: OS, overall survival; PFS, progression-free survival.
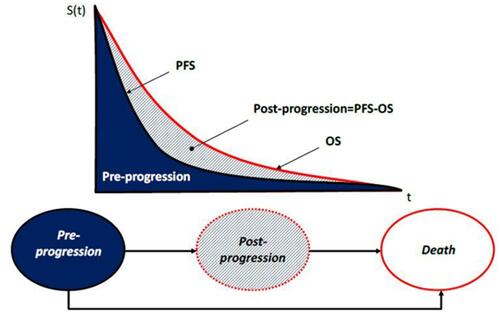
Table 1 Utilities and Disutilities Incorporated in the Model
Table 2 Drug Costs Considered in the Model
Table 3 Resource Use and Unit Costs in Pre-Progression, Post-Progression and End-of-Life Health States
Table 4 AEs Rates and Costs for Cemiplimab and Chemotherapy
Figure 2 Hazard of progression: comparison between base case and pessimistic scenario.
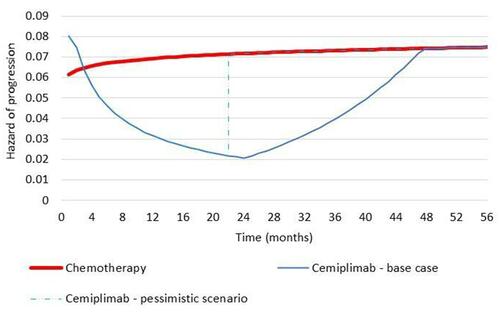
Table 5 Base-Case Results
Figure 3 Cost-effectiveness acceptability curve.
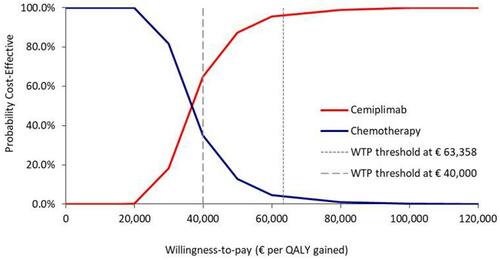
Figure 4 Cost-effectiveness plane.
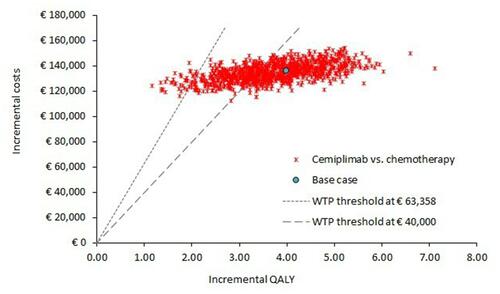
Table 6 Scenario Analysis Results